Rearrangement of retinogeniculate projection patterns after eye-specific segregation in mice
- PMID: 20544023
- PMCID: PMC2882329
- DOI: 10.1371/journal.pone.0011001
Rearrangement of retinogeniculate projection patterns after eye-specific segregation in mice
Abstract
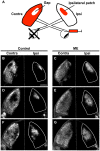
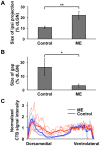
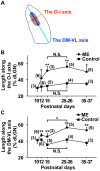
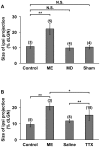
It has been of interest whether and when the rearrangement of neuronal circuits can be induced after projection patterns are formed during development. Earlier studies using cats reported that the rearrangement of retinogeniculate projections could be induced even after eye-specific segregation has occurred, but detailed and quantitative characterization of this rearrangement has been lacking. Here we delineate the structural changes of retinogeniculate projections in the C57BL/6 mouse in response to monocular enucleation (ME) after eye-specific segregation. When ME was performed after eye-specific segregation, rearrangement of retinogeniculate axons in the dorsal lateral geniculate nucleus (dLGN) was observed within 5 days. Although this rearrangement was observed both along the dorsomedial-ventrolateral and outer-inner axes in the dLGN, it occurred more rapidly along the outer-inner axis. We also examined the critical period for this rearrangement and found that the rearrangement became almost absent by the beginning of the critical period for ocular dominance plasticity in the primary visual cortex. Taken together, our findings serve as a framework for the assessment of phenotypes of genetically altered mouse strains as well as provide insights into the mechanisms underlying the rearrangement of retinogeniculate projections.
Conflict of interest statement
Figures


Similar articles
-
Eye-specific retinogeniculate segregation proceeds normally following disruption of patterned spontaneous retinal activity.Neural Dev. 2014 Nov 7;9:25. doi: 10.1186/1749-8104-9-25. Neural Dev. 2014. PMID: 25377639 Free PMC article.
-
Nogo-A deletion increases the plasticity of the optokinetic response and changes retinal projection organization in the adult mouse visual system.Brain Struct Funct. 2016 Jan;221(1):317-29. doi: 10.1007/s00429-014-0909-3. Epub 2014 Oct 5. Brain Struct Funct. 2016. PMID: 25284126
-
Prenatal and postnatal development of retinogeniculate and retinocollicular projections in the mouse.J Comp Neurol. 1984 Dec 20;230(4):552-75. doi: 10.1002/cne.902300406. J Comp Neurol. 1984. PMID: 6520251
-
'Hidden lamination' in the dorsal lateral geniculate nucleus: the functional organization of this thalamic region in the rat.Brain Res. 1988 Apr-Jun;472(2):119-37. doi: 10.1016/0165-0173(88)90017-3. Brain Res. 1988. PMID: 3289687 Review.
-
Development of On and Off retinal pathways and retinogeniculate projections.Prog Retin Eye Res. 2004 Jan;23(1):31-51. doi: 10.1016/j.preteyeres.2003.10.001. Prog Retin Eye Res. 2004. PMID: 14766316 Review.
Cited by
-
Structural and Functional Plasticity in the Dorsolateral Geniculate Nucleus of Mice following Bilateral Enucleation.Neuroscience. 2022 Apr 15;488:44-59. doi: 10.1016/j.neuroscience.2022.01.029. Epub 2022 Feb 4. Neuroscience. 2022. PMID: 35131394 Free PMC article.
-
Serotonin sensing by microglia conditions the proper development of neuronal circuits and of social and adaptive skills.Mol Psychiatry. 2023 Jun;28(6):2328-2342. doi: 10.1038/s41380-023-02048-5. Epub 2023 May 22. Mol Psychiatry. 2023. PMID: 37217677
-
Ocular dominance columns in V1 are more susceptible than associated callosal patches to imbalance of eye input during precritical and critical periods.J Comp Neurol. 2021 Aug 1;529(11):2883-2910. doi: 10.1002/cne.25134. Epub 2021 Mar 17. J Comp Neurol. 2021. PMID: 33683706 Free PMC article.
-
Distribution and Morphological Features of Microglia in the Developing Cerebral Cortex of Gyrencephalic Mammals.Neurochem Res. 2018 May;43(5):1075-1085. doi: 10.1007/s11064-018-2520-0. Epub 2018 Apr 3. Neurochem Res. 2018. PMID: 29616442
-
BMP signaling alters aquaporin-4 expression in the mouse cerebral cortex.Sci Rep. 2021 May 18;11(1):10540. doi: 10.1038/s41598-021-89997-5. Sci Rep. 2021. PMID: 34006980 Free PMC article.
References
-
- Cramer KS, Sur M. Activity-dependent remodeling of connections in the mammalian visual system. Curr Opin Neurobiol. 1995;5:106–111. - PubMed
-
- Katz LC, Shatz CJ. Synaptic activity and the construction of cortical circuits. Science. 1996;274:1133–1138. - PubMed
-
- Penn AA, Shatz CJ. Brain waves and brain wiring: the role of endogenous and sensory-driven neural activity in development. Pediatr Res. 1999;45:447–458. - PubMed
-
- Guido W. Cellular mechanisms underlying the remodeling of retinogeniculate connections. In: Erzurumlu RS, Guido W, Molnar Z, editors. Development and Plasticity in Sensory Thalamus and Cortex. New York: Springer; 2006. pp. 208–227.
-
- Hooks BM, Chen C. Critical periods in the visual system: changing views for a model of experience-dependent plasticity. Neuron. 2007;56:312–326. - PubMed
Publication types
MeSH terms
LinkOut - more resources
Full Text Sources
Miscellaneous

