. 2011 Apr;30(2):225-40.
doi: 10.1007/s10827-010-0249-0. Epub 2010 Jun 11.

Dual oscillator model of the respiratory neuronal network generating quantal slowing of respiratory rhythm

Affiliations

Dual oscillator model of the respiratory neuronal network generating quantal slowing of respiratory rhythm

Amit Lal et al. J Comput Neurosci. 2011 Apr.

Abstract

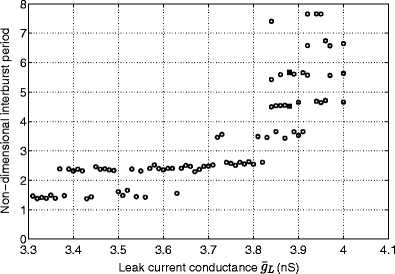
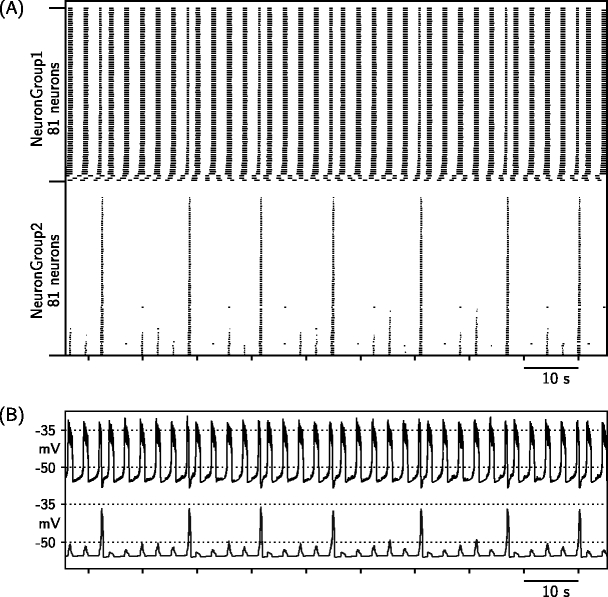
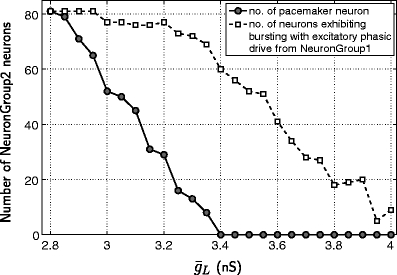
We developed a dual oscillator model to facilitate the understanding of dynamic interactions between the parafacial respiratory group (pFRG) and the preBötzinger complex (preBötC) neurons in the respiratory rhythm generation. Both neuronal groups were modeled as groups of 81 interconnected pacemaker neurons; the bursting cell model described by Butera and others [model 1 in Butera et al. (J Neurophysiol 81:382-397, 1999a)] were used to model the pacemaker neurons. We assumed (1) both pFRG and preBötC networks are rhythm generators, (2) preBötC receives excitatory inputs from pFRG, and pFRG receives inhibitory inputs from preBötC, and (3) persistent Na(+) current conductance and synaptic current conductances are randomly distributed within each population. Our model could reproduce 1:1 coupling of bursting rhythms between pFRG and preBötC with the characteristic biphasic firing pattern of pFRG neurons, i.e., firings during pre-inspiratory and post-inspiratory phases. Compatible with experimental results, the model predicted the changes in firing pattern of pFRG neurons from biphasic expiratory to monophasic inspiratory, synchronous with preBötC neurons. Quantal slowing, a phenomena of prolonged respiratory period that jumps non-deterministically to integer multiples of the control period, was observed when the excitability of preBötC network decreased while strengths of synaptic connections between the two groups remained unchanged, suggesting that, in contrast to the earlier suggestions (Mellen et al., Neuron 37:821-826, 2003; Wittmeier et al., Proc Natl Acad Sci USA 105(46):18000-18005, 2008), quantal slowing could occur without suppressed or stochastic excitatory synaptic transmission. With a reduced excitability of preBötC network, the breakdown of synchronous bursting of preBötC neurons was predicted by simulation. We suggest that quantal slowing could result from a breakdown of synchronized bursting within the preBötC.


Figures

Fig. 1
Fig. 1
(a) Dual Oscillator Model: NeuronGroup1 (pFRG) provides excitatory synaptic input to NeuronGroup2 (preBötC) and NeuronGroup2 provides inhibitory synaptic input directly to NeuronGroup1. (b) Three neuronal group model: Similar to Dual Oscillator Model except that an inspiratory interneuron group, NeuronGroup3 is added. NeuronGroup3 receives excitatory inputs from NeuronGroup2 and inhibit NeuronGroup1. Open and closed circles represent excitatory and inhibitory synaptic connections, respectively
Fig. 2
Fig. 2
(a) Raster plots of various coupling modes—biphasic (formula image nS, formula image nS), monophasic (formula image nS, formula image nS), Synchronous (formula image nS, formula image nS), 2:1 coupling (with inhibition: formula image nS, formula image nS; no inhibition: formula image nS, formula image nS), and intermittent (formula image nS, formula image nS; intermittent regular also corresponds to the same values of synaptic strengths)—observed by changing the strengths of excitatory and inhibitory synaptic conductances. The neurons within each neuronal groups are ranked in ascending order of their bursting activity initiation timings for better visualization. (b) Corresponding averaged population activity of NeuronGroup1 and NeuronGroup2 (top and bottom traces, respectively, in each panel) and (c) Activity of a typical neuron belonging to NeuronGroup1 and NeuronGroup2 (top and bottom traces, respectively, in each panel)
Fig. 3
Fig. 3
(a) Domain of occurrence of coupling modes as a function of excitatory and inhibitory synaptic strengths of the dual oscillator model. For each combination of formula image and formula image, seven simulations were performed and the frequency of occurrence of various coupling modes are illustrated using the gray color scale indicated on the right. (b) Representative domain of various coupling modes based on maximum occurrence frequency. For simplicity, the occurrence frequency of the two types of intermittent coupling modes were merged together, since their occurrence domain overlaps
Fig. 4
Fig. 4
Effect of increase in formula image value on the coupling mode between NeuronGroup1 and NeuronGroup2. With the successive increase in formula image, the coupling mode which is originally biphasic (Fig. 2(a), biphasic) changes to (a) 2:1 coupling, (b) 3:1 coupling and eventually (c) quantal slowing—NeuronGroup2 exhibits bursting non-deterministically at fourth or fifth phasic excitations from NeuronGroup1. In raster plots, the neurons within each neuronal groups are ranked in ascending order of their bursting activity initiation timings for better visualization. (d) Averaged population activity of NeuronGroup1 (top trace) and NeuronGroup2 (bottom trace) corresponding to the quantal slowing case depicted in (c)
Fig. 5
Fig. 5
(a) Plot depicting the non-deterministic variation of interburst interval of NeuronGroup2 with time. The vertical separation between the horizontal grid lines indicates the interburst interval of NeuronGroup1. NeuronGroup2 exhibits bursts, non-deterministically, at the third, fourth, fifth, sixth, seventh and ninth phasic excitatory drives from NeuronGroup1.(b) Population activities of NeuronGroup1 and NeuronGroup2 for the time interval depicted by the thick gray bar in (a). For the above simulation, the values of formula image, formula image and formula image were 0.8 nS, 4.5 nS and 3.89 nS, respectively
Fig. 6
Fig. 6
Interburst interval of NeuronGroup2 as a function of formula image. The interburst interval of NeuronGroup2 is non-dimesionlized to remove the variability in interburst interval of NeurnGroup2 caused by variability in the interburst interval of NeuronGroup1. A new simulation is performed for each value of formula image. For formula image3.84 nS, we observed single bursting frequency of NeuronGroup2. Quantal slowing was observed in the range 3.84 nS formula image 4.0 nS; multiple data points corresponding to the same value of formula image in this range depicts the multiple interburst intervals observed. For example, the two solid squares depicts the the two interburst interval of NeuronGroup2 obtained for the case formula image nS shown in Fig. 4(c)
Fig. 7
Fig. 7
Quantal slowing observed when formula image of NeuronGroup2 was reduced to 2.09 nS (formula image = 0.8 nS, formula image = 4.5 nS). (a) Raster plots depicting the bursting activity of neurons within NeuronGroup1 and NeuronGroup2, and (b) Averaged population activity within NeuronGroup1 and NeuronGroup2 (top and bottom trace, respectively). In raster plot, the neurons within each neuronal groups are ranked in ascending order of their bursting activity initiation timings for better visualization
Fig. 8
Fig. 8
Histograms showing the number of cells in NeuronGroup2 exhibiting simultaneous bursting during the quantal slowing case depicted in Fig. 4(c)
Fig. 9
Fig. 9
Variability in the number of neurons in NeuronGroup2 exhibiting bursting under the influence of excitatory phasic drive from NeuronGroup1. The neurons in NeuronGroup2 are unconnected (formula image nS for all neurons in NeuronGroup2) and formula image = 0.8 nS and formula image = 0 nS. In raster plot, the neurons within NeuronGroup1 are ranked in ascending order of their bursting activity initiation timings for better visualization
Fig. 10
Fig. 10
Typical decrease in the number of neurons with pacemaker property in NeuronGroup2 as formula image value is increased

References

    1. Ballanyi K, Onimaru H, Homma I. Respiratory network function in the isolated brainstem-spinal cord of newborn rats. Progress in Neurobiology. 1999;59:583–634. doi: 10.1016/S0301-0082(99)00009-X. - DOI - PubMed
    1. Barnes BJ, Tuong CM, Mellen NM. Functional imaging reveals respiratory network activity during hypoxic and opioid challenge in the neonate rat tilted sagittal slab preparation. Journal of Neurophysiology. 2007;97:2283–2292. doi: 10.1152/jn.01056.2006. - DOI - PubMed
    1. Butera RJ, Rinzel J, Smith JC. Models of respiratory rhythm generation in the pre-Bötzinger complex. I. Burting pacemaker neurons. Journal of Neurophysiology. 1999;81:382–397. - PubMed
    1. Butera RJ, Rinzel J, Smith JC. Models of respiratory rhythm generation in the pre-Bötzinger complex. II. Populations of coupled pacemaker neurons. Journal of Neurophysiology. 1999;81:398–415. - PubMed
    1. Feldman JL, Del Negro CA. Looking for inspiration: New perspectives on respiratory rhythm. Nature Reviews Neuroscience. 2006;7:232–242. doi: 10.1038/nrn1871. - DOI - PMC - PubMed

Publication types

LinkOut - more resources