. 2010 Jul;42(1):78-87.
doi: 10.1002/mus.21599.

Steadiness in plantar flexor muscles and its relation to postural sway in young and elderly adults

Affiliations

Steadiness in plantar flexor muscles and its relation to postural sway in young and elderly adults

Motoki Kouzaki et al. Muscle Nerve. 2010 Jul.

Abstract

To investigate the functional significance of force fluctuations during voluntary contraction with a select muscle group, we examined the association between force fluctuations during voluntary contraction with plantar flexor muscles and postural sway during quiet standing in 20 young and 20 elderly adults. Young and elderly subjects maintained a quiet standing position on a force platform. They also performed a force-matching task with unilateral isometric plantar flexion. A positive correlation was found in young and elderly adults between the coefficient of variation (CV) of center of pressure during quiet standing and the CV of force during plantar flexion only at contraction intensities of < or =5% maximum voluntary contraction that corresponded to muscle activity during quiet standing. The electromyogram power in the medial gastrocnemius was greater in the elderly than in young adults by approximately 10 Hz during quiet standing and at low contraction intensities during plantar flexion. Fluctuations in motor output during low-intensity plantar flexion were associated with postural sway during quiet standing in both young and elderly adults.


Figures
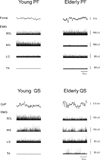
Figure 1
Figure 1
Representative recordings of fluctuations in plantar flexion force or foot center of pressure (CoP), rectified electromyogram (EMG) in soleus (SOL), medial gastrocnemius (MG), lateral gastrocnemius (LG) and tibialis anterior (TA) during steady isometric plantar flexion (PF) at 5% of maximal voluntary contraction (top panels) and during quiet standing (QS) (bottom panels) in young (left column) and elderly (right column) adults.
Figure 2
Figure 2
The coefficient of variation (CV) of force during PF at various intensities (a) and the CV of CoP during QS (b). Open and filled bars indicate young and elderly adults, respectively. *, significant difference between young and elderly adults (P < 0.05).
Figure 3
Figure 3
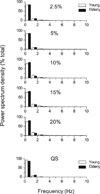
Power spectrum density of force during PF at various intensities and during QS (bottom). Power spectrum density is presented every 1-Hz bin as a percentage of total power. Open and filled bars indicate young and elderly adults, respectively.
Figure 4
Figure 4
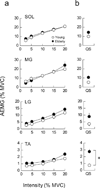
The amplitude of EMG (AEMG) in SOL, MG, LG and TA during PF at various intensities (a) and during QS (b) in young and elderly adults. Open and filled symbols indicate young and elderly adults, respectively. *, significant difference between young and elderly subjects (P < 0.05).
Figure 5
Figure 5
The CV of CoP as a function of AEMG of TA during QS in young and elderly adults. Open and filled symbols indicate young and elderly adults, respectively. The superimposed line indicate the linear regression line with statistical significance for elderly subjects (n = 20, P < 0.01).
Figure 6
Figure 6
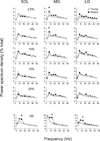
Power spectrum density of the rectified EMG in SOL, MG, LG and TA during PF at various intensities and during QS (bottom). Power spectrum density is presented every 5-Hz bin as a percentage of total power. Open and filled symbols indicate young and elderly adults, respectively. *, significant difference between young and elderly subjects (P < 0.05).
Figure 7
Figure 7
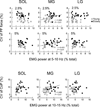
Scatter plots of the CV of PF as a function of the power spectrum density of the rectified EMG at 5–10 Hz bin for SOL, MG and LG during PF (upper panels). Scatter plots of the CV of CoP as a function of the power spectrum density of the rectified EMG at 10–15 Hz bin for SOL, MG and LG during QS (lower panels). Power spectrum density is presented as a percentage of total power. Open and filled symbols indicate young and elderly adults, respectively. Superimposed lines indicate the linear regression lines with statistical significance (n = 40, P < 0.05) for young and elderly adults combined.
Figure 8
Figure 8
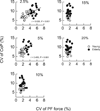
Scatter plots of the CV of CoP as a function of the CV of PF force at various intensities in young (open symbols) and elderly (filled symbols) adults. Superimposed lines indicate the linear regression lines with statistical significance (n = 40, P < 0.05) for young and elderly adults combined.

Similar articles

Cited by

References

    1. Galganski ME, Fuglevand AJ, Enoka RM. Reduced control of motor output in a human hand muscle of elderly subjects during submaximal contractions. J Neurophysiol. 1993;69:2108–2115. - PubMed
    1. Kornatz KW, Christou EA, Enoka RM. Practice reduces motor unit discharge variability in a hand muscle and improves manual dexterity in old adults. J Appl Physiol. 2005;98:2072–2080. - PubMed
    1. Enoka RM, Christou EA, Hunter SK, Kornatz KW, Semmler JG, Taylor AM, et al. Mechanisms that contribute to differences in motor performance between young and old adults. J Electromyogr Kinesiol. 2003;13:1–12. - PubMed
    1. Manini TM, Cook SB, Ordway NR, Ploutz-Snyder RJ, Ploutz-Snyder LL. Knee extensor isometric unsteadiness does not predict functional limitation in older adults. Am J Phys Med Rehabil. 2005;84:112–121. - PubMed
    1. Maki BE, Holliday PJ, Fernie GR. Aging and postural control: a comparison of spontaneous- and induced-sway balance tests. J Am Geriatr Soc. 1990;38:1–9. - PubMed

Publication types