Review
. 2010 Jul;23(5):497-511.
doi: 10.1002/ca.21006.

Magnetic resonance elastography: a review

Affiliations
Review

Magnetic resonance elastography: a review

Yogesh K Mariappan et al. Clin Anat. 2010 Jul.

Abstract

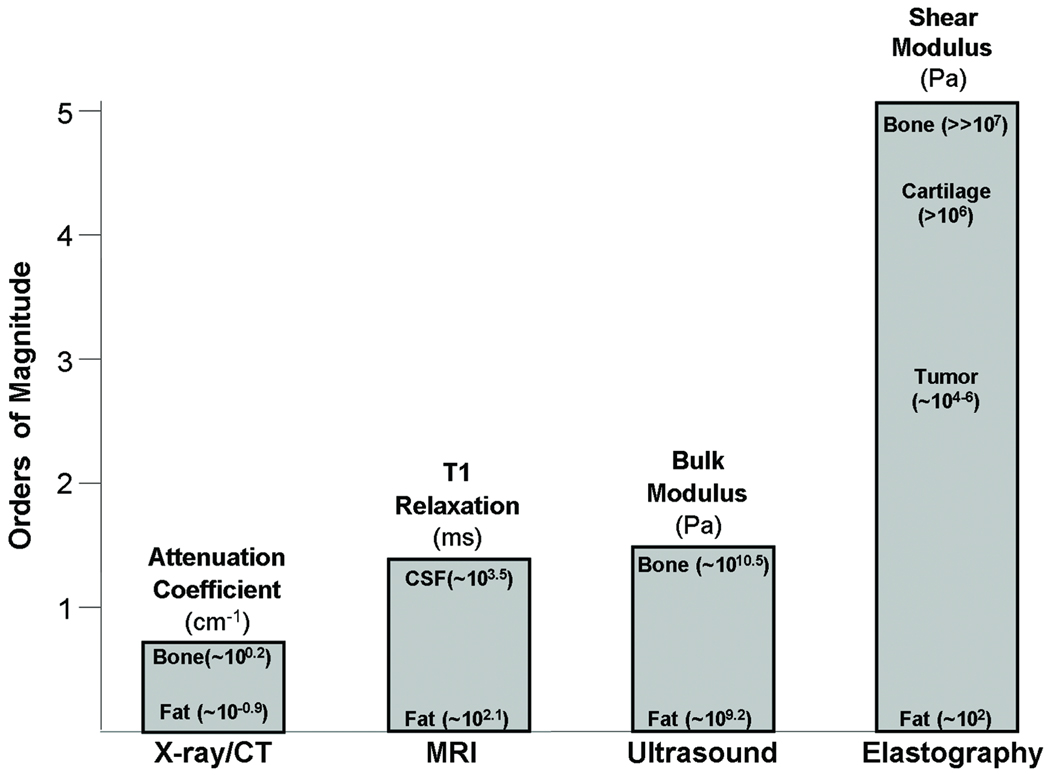
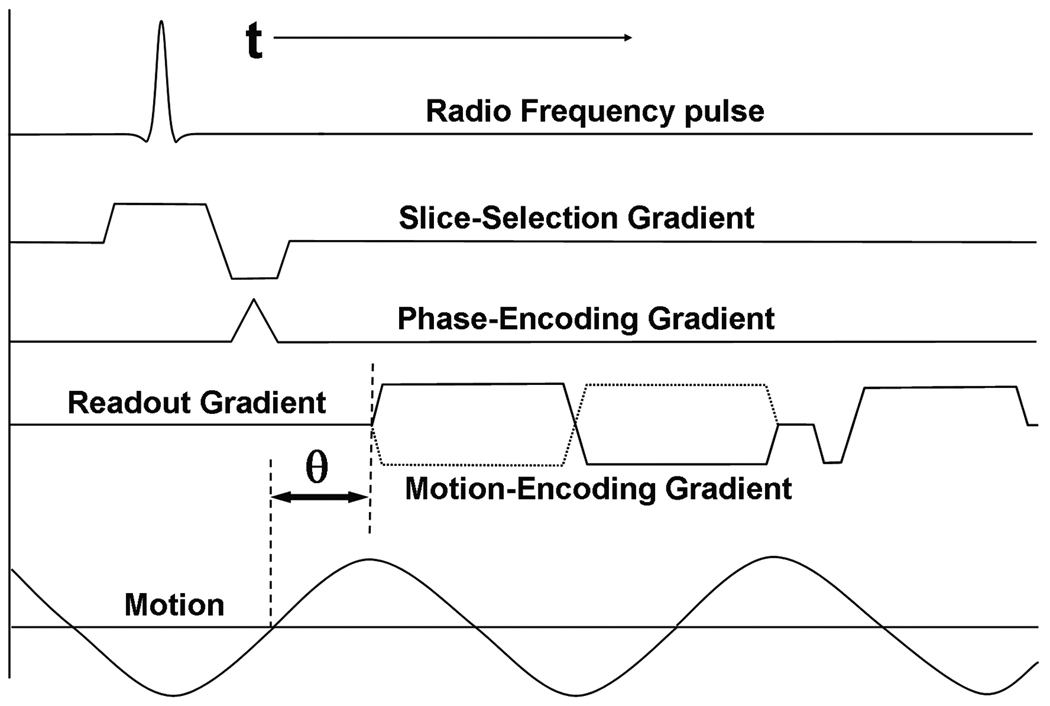
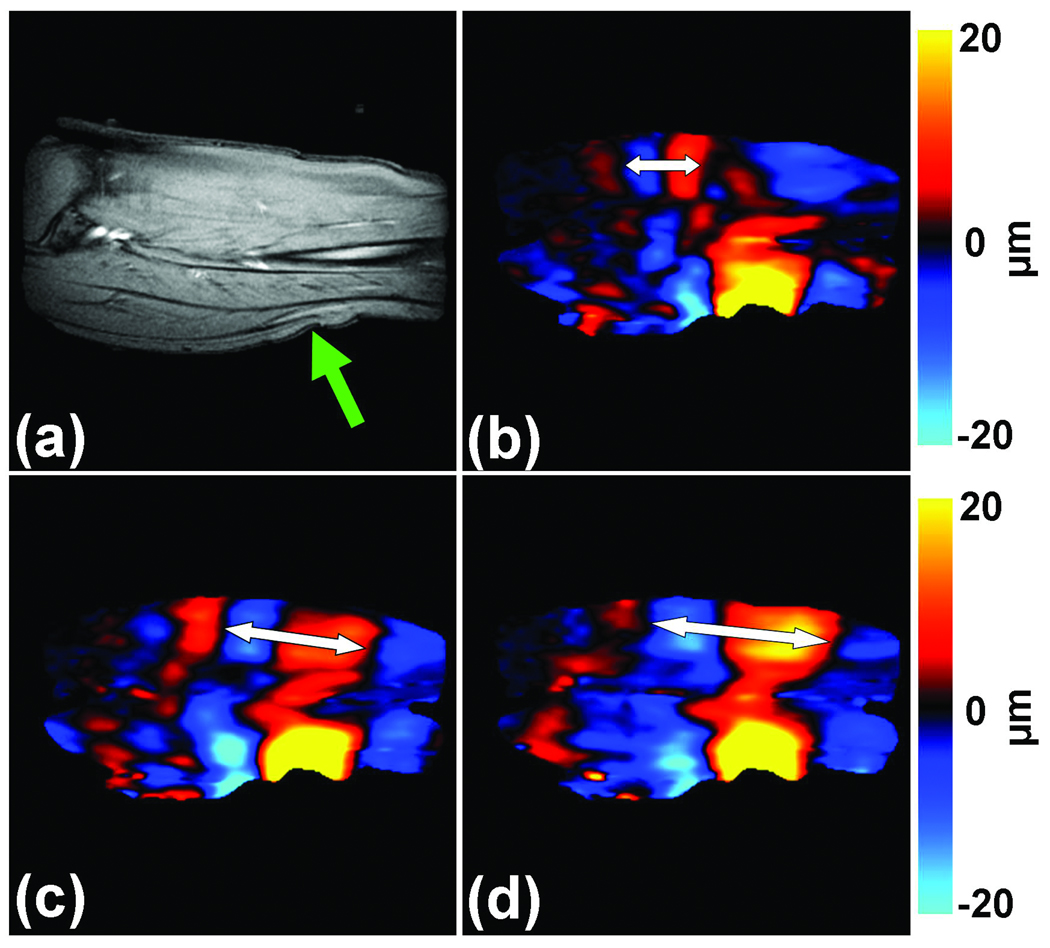
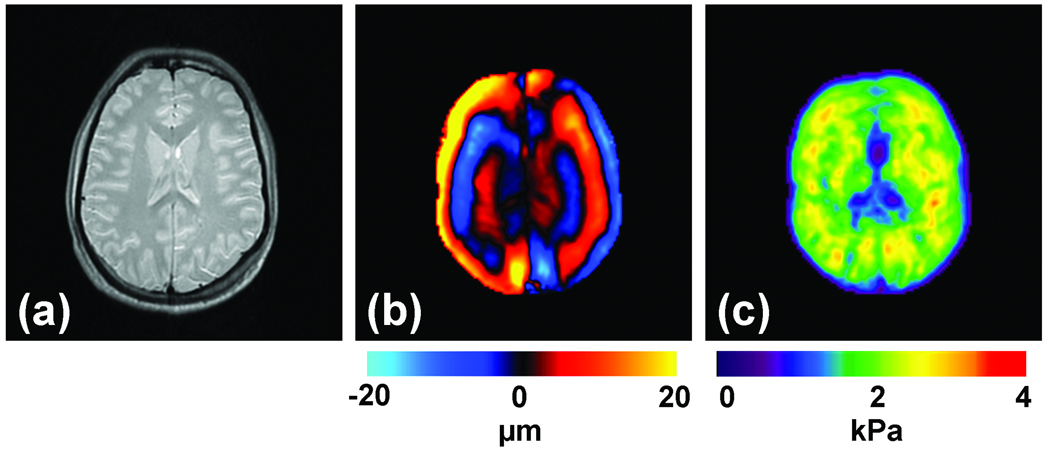
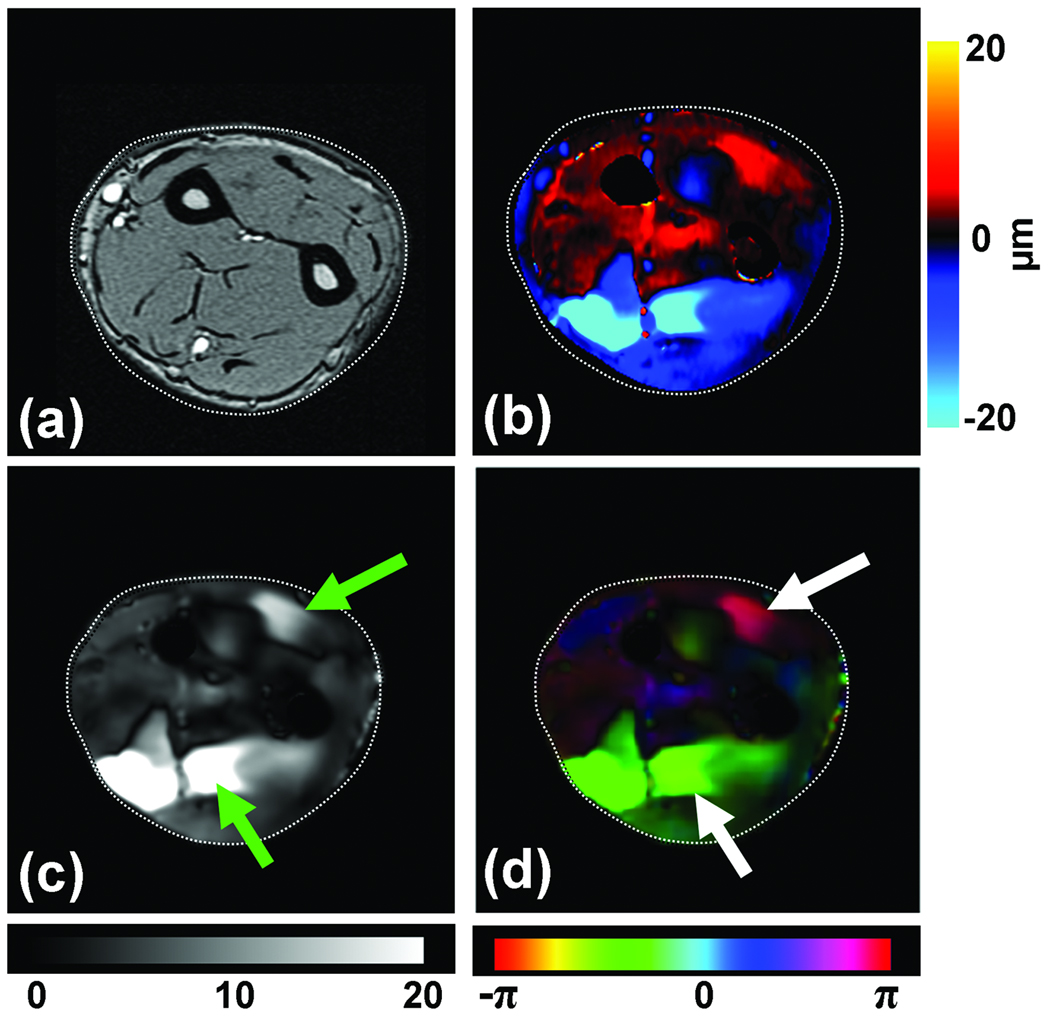
Magnetic resonance elastography (MRE) is a rapidly developing technology for quantitatively assessing the mechanical properties of tissue. The technology can be considered to be an imaging-based counterpart to palpation, commonly used by physicians to diagnose and characterize diseases. The success of palpation as a diagnostic method is based on the fact that the mechanical properties of tissues are often dramatically affected by the presence of disease processes, such as cancer, inflammation, and fibrosis. MRE obtains information about the stiffness of tissue by assessing the propagation of mechanical waves through the tissue with a special magnetic resonance imaging technique. The technique essentially involves three steps: (1) generating shear waves in the tissue, (2) acquiring MR images depicting the propagation of the induced shear waves, and (3) processing the images of the shear waves to generate quantitative maps of tissue stiffness, called elastograms. MRE is already being used clinically for the assessment of patients with chronic liver diseases and is emerging as a safe, reliable, and noninvasive alternative to liver biopsy for staging hepatic fibrosis. MRE is also being investigated for application to pathologies of other organs including the brain, breast, blood vessels, heart, kidneys, lungs, and skeletal muscle. The purpose of this review article is to introduce this technology to clinical anatomists and to summarize some of the current clinical applications that are being pursued.


Figures

Figure 1
Figure 1. Imaging modality contrast mechanisms
Examples of different imaging modalities and the spectrum of contrast mechanisms utilized by them are shown. The shear modulus has the largest variation with variations over 5 orders of magnitude among various physiological states of normal and pathologic tissues.
Figure 2
Figure 2. Various approaches to elasticity imaging
The flowchart lists the various approaches to the three basic steps to elasticity imaging: (1) excitation application, (2) tissue response detection, and (3) calculation of the mechanical properties of the tissue.
Figure 3
Figure 3. External driver systems
(a) Block diagram of the external driver setup. Examples of typical mechanical drivers include (b) electromechanical, (c) piezoelectric-stack, and (d) pressure-activated driver systems.
Figure 4
Figure 4. MRE pulse sequence
Shown is an example of a gradient-recalled echo MRE pulse sequence diagram. A typical bipolar motion-encoding gradient (MEG) is shown (solid line) as well as the negative MEG (dotted line) used for phase-contrast imaging. The motion waveform and its temporal relationship (θ) with the MEG are also shown.
Figure 5
Figure 5. MRE of an inclusion phantom
(a) MR magnitude image of an inclusion phantom with soft and stiff inclusions seen as the hyperintense and hypointense regions, respectively. (b) A single wave image from the MRE acquisition performed at 100 Hz. The difference in the wavelengths in the different regions is evident. (c) An elastogram obtained from these data showing the stiff and soft regions.
Figure 6
Figure 6. Liver stiffness due to Fibrosis
MRE-derived stiffness of healthy liver tissue at 60 Hz compared to the stiffness of liver tissue at various stages of fibrosis. The stiffness increases gradually with the progression of the fibrosis. A cutoff of 2.93 kPa well differentiates the healthy and fibrotic livers.
Figure 7
Figure 7. Hepatic MRE
Results are shown from clinical hepatic MRE exams of a patient with a normal liver (top row) and a patient with a cirrhotic liver. (a,d) Conventional abdominal MR magnitude images of the two patients, showing no significant difference between the two livers. (b,e) Wave images from the MRE acquisition at 60 Hz showing shear waves with a shorter wavelength in the first patient, and a substantially longer wavelength in the second patient. (c,f) The corresponding elastograms indicating that the two livers were normal (1.7 kPa) and cirrhotic (18.83 kPa), respectively.
Figure 8
Figure 8. Breast MRE
(a) An axial MR magnitude image of the right breast of a patient volunteer is shown. A large adenocarcinoma is shown as the outlined, mildly hyperintense region on the lateral side of the breast. (b) A single wave image from MRE performed at 100 Hz is shown along with the corresponding elastogram (c). (d) An overlay image of the elastogram and the magnitude image shows good correlation between the tumor and the stiff region detected by MRE.
Figure 9
Figure 9. Skeletal muscle MRE
(a) A sagittal MR image of the calf soleus muscle with the location of the driver indicated by the arrow is shown. 100-Hz MRE wave images of the muscle are shown while exerting 0 (b), 5 (c) and 10 N/m (d) of force. The increase in the wavelength (and thus stiffness) with the increase in muscle force is easily visible and is indicated by the double sided arrows.
Figure 10
Figure 10. Brain MRE
(a) Shown is an axial MR magnitude image of the brain showing white matter, gray matter, and cerebrospinal fluid. (b) A single wave image from MRE performed at 60 Hz. (c) The corresponding elastogram is shown and a good correlation between the magnitude image and the stiffness estimate is evident.
Figure 11
Figure 11. Functional compartments of the flexor muscles
(a) MR magnitude image of the right forearm of a healthy volunteer. (b) An example wave image obtained using MRE motion encoding of tissue vibrations in the forearm induced by selectively vibrating the ring finger at 90 Hz. (c) An amplitude map obtained from wave images indicating localized regions of higher displacement corresponding to the compartments of the flexor and extensor muscles (arrows). (d) A phase map obtained from the wave images indicating that the compartments of the flexor and extensor muscles of the activated finger are moving out of phase with each other.

Similar articles

Cited by

References

    1. Asbach P, Klatt D, Hamhaber U, Braun J, Somasundaram R, Hamm B, Sack I. Assessment of liver viscoelasticity using multifrequency MR elastography. Magn Reson Med. 2008;60:373–379. - PubMed
    1. Auld BA. Acoustic fields and waves in solids. 2nd ed. Malabar, Florida: R.E. Krieger; 1990.
    1. Axel L, Dougherty L. MR imaging of motion with spatial modulation of magnetization. Radiology. 1989;171:841–845. - PubMed
    1. Bae U, Dighe M, Dubinsky T, Minoshima S, Shamdasani V, Kim Y. Ultrasound thyroid elastography using carotid artery pulsation: preliminary study. Journal of Ultrasound in Medicine. 2007;26:797–805. - PubMed
    1. Barton MB, Harris R, Fletcher SW. Does This Patient Have Breast Cancer?: The Screening Clinical Breast Examination: Should It Be Done? How? JAMA. 1999;282:1270–1280. - PubMed

Publication types

LinkOut - more resources