. 2010 Aug 1;78(10):2265-82.
doi: 10.1002/prot.22739.

Allosteric effects of the antipsychotic drug trifluoperazine on the energetics of calcium binding by calmodulin

Affiliations

Allosteric effects of the antipsychotic drug trifluoperazine on the energetics of calcium binding by calmodulin

Michael D Feldkamp et al. Proteins. .

Abstract

Trifluoperazine (TFP; Stelazine) is an antagonist of calmodulin (CaM), an essential regulator of calcium-dependent signal transduction. Reports differ regarding whether, or where, TFP binds to apo CaM. Three crystallographic structures (1CTR, 1A29, and 1LIN) show TFP bound to (Ca(2+))(4)-CaM in ratios of 1, 2, or 4 TFP per CaM. In all of these, CaM domains adopt the "open" conformation seen in CaM-kinase complexes having increased calcium affinity. Most reports suggest TFP also increases calcium affinity of CaM. To compare TFP binding to apo CaM and (Ca(2+))(4)-CaM and explore differential effects on the N- and C-domains of CaM, stoichiometric TFP titrations of CaM were monitored by (15)N-HSQC NMR. Two TFP bound to apo CaM, whereas four bound to (Ca(2+))(4)-CaM. In both cases, the preferred site was in the C-domain. During the titrations, biphasic responses for some resonances suggested intersite interactions. TFP-binding sites in apo CaM appeared distinct from those in (Ca(2+))(4)-CaM. In equilibrium calcium titrations at defined ratios of TFP:CaM, TFP reduced calcium affinity at most levels tested; this is similar to the effect of many IQ-motifs on CaM. However, at the highest level tested, TFP raised the calcium affinity of the N-domain of CaM. A model of conformational switching is proposed to explain how TFP can exert opposing allosteric effects on calcium affinity by binding to different sites in the "closed," "semi-open," and "open" domains of CaM. In physiological processes, apo CaM, as well as (Ca(2+))(4)-CaM, needs to be considered a potential target of drug action.


Figures

Figure 1
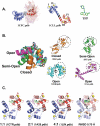
Figure 1. Structural Background of CaM-Target Interactions
A: Superposition of models of the solution structures of CaM (1CFC.pdb) that have been determined by NMR. Left: Alignment minimized the difference between models with respect to the N-domain (residues 1-75 in blue), illustrating the flexibility of the interdomain linker (resides 76-80 in black) and range of relative positions adopted by the C-domain (residues 81-148 in red). A single model is highlighted to reveal the tertiary structures of the apo N- and C-domains (each is a 4-helix bundle). Middle: (Ca2+)4-CaM structure determined crystallographically (1CLL.PDB); backbone colored as in panel A. Ca2+ ions (yellow) are bound at sites I and II in the N-domain, and at sites III and IV in the C-domain. Right: Chemical structure of the antipsyschotic drug Trifluoperazine (TFP; green), with sulfur atom in yellow and fluorine atoms in light blue. Figure created with Pymol™. B: Superposition of 3 Tertiary Structures of the C-domain of CaM. Examples of the “closed” (1CFC.pdb–orange), “semi-open” (2IX7.pdb–green) and “open” (1CDM.pdb–aqua and 1CLL.pdb–magenta) conformations of the C-domain of CaM are aligned according to the positions of the F and G (second and third) helices of the domain. Structures of the corresponding full-length CaM is shown below. Figure created with Pymol™. C: Structures of (Ca2+)4-CaM bound to TFP. Individual panels show crystallographically derived structures of TFP:(Ca2+)4-CaM complexes, with drug:protein ratios of 1:1 (1CTR.pdb), 2:1 (1A29.pdf), and 4:1 (1LIN.pdb), as well as a structural superposition of these three structures, with the TFP-binding sites labeled A (green), B (magenta), C (brown) and D (orange). TFP-binding sites A and B are located in the C-domain (backbone red), site C bridges the two domains, and site D is located in the N-domain (backbone blue). Figure created with Pymol™.
Figure 2
Figure 2. 15N-HSQC-monitored TFP titration of uniformly 15N-labeled apo PCaM
A: Comparison of subset of 15N-HSQC spectra for apo PCaM (black) and TFP-saturated apo PCaM (red); arrows indicate change in resonance positions over the course of the TFP titration. B: Normalized TFP-induced chemical shifts of individual representative residues of apo CaM. C: Bar graph of net chemical shift per residue caused by TFP saturation of CaM. D: Location of each apo CaM residue whose chemical shift was perturbed > 0.05 ppm by TFP saturation (white spheres); backbone modeled as that of apo CaM (1DMO.pdb). Solution conditions: 10% D2O, 10 mM imidazole, 100 mM KCl, 50 μM EDTA, 5mM, pH 6.5 at 22°C. Figure created with Pymol™.
Figure 3
Figure 3. 15N-HSQC-monitored TFP titration of uniformly 15N-labeled (Ca2+)4-CaM
A: Comparison of (Ca2+)4-CaM (black) and TFP-saturated (Ca2+)4-CaM (red) 15N-HSQC spectra, arrows indicate change in resonance positions over the course of the TFP titration. B: Normalized TFP-induced chemical shifts of individual representative residues of (Ca2+)4-CaM. C: Bar graph of net chemical shift per residue caused by TFP saturation of CaM. D: Location of each (Ca2+)4-CaM residue whose chemical shift was perturbed > 0.05 ppm by TFP saturation (white spheres); backbone modeled according to the structure of TFP bound to (Ca2+)4-CaM at a 4:1 ratio (1LIN.pdb). Solution conditions: 10% D2O, 10 mM imidazole, 100 mM KCl, 50 μM EDTA, 5mM CaCl2, pH 6.5 at 22°C. Figure created with Pymol™.
Figure 4
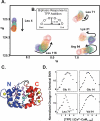
Figure 4. Multiple chemical environments observed upon TFP titration of (Ca2+)4-CaM
A: 15N-HSQC spectrum of uniformly 15N labeled (Ca2+)4-CaM titrated with TFP, where arrows represent the movement of each resonance from its initial position. B: Schematic diagram of quantitative criterion for classification of biphasic chemical shift. C: Locations of select residues that underwent a biphasic response upon TFP addition, mapped onto the structure of TFP bound to (Ca2+)4-CaM at a 4:1 ratio (1LIN.pdb). D: Normalized chemical shift plots for select individual residues deemed to undergo a biphasic response upon TFP titration of (Ca2+)4-CaM. Solution conditions: 10% D2O, 10 mM imidazole, 100 mM KCl, 50 μM EDTA, 5mM CaCl2, pH 6.5 at 22°C. Figure created with Pymol™.
Figure 5
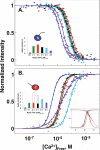
Figure 5. Effect of TFP on Calcium Binding to CaM1-148
Equilibrium calcium titrations of CaM (6 μM) were conducted in the presence of 0 (blue), 6 (green, 1:1), 12 (red, 2:1), 18 (black, 3:1), 24 (cyan, 4:1), or 48 μM (purple, 8:1 TFP:CaM) TFP, and were monitored using the intrinsic fluorescence of CaM. A: phenylalanine fluorescence (250 nmex and 280 nmem). B: tyrosine fluorescence (277 nmex and 320 nmem). In B, for 3:1, 4:1 and 8:1 TFP:CaM, the raw signal decreased; it is shown inverted to facilitate comparisons. Solid curves were simulated according to Eq. 3 and free energies in Table 1; bar graph insets represent ΔΔG2 values in Table 1. Solution conditions: 50 mM HEPES, 100 mM KCl, 5 mM KCl, 0.05 mM EGTA, 1 mM MgCl2, and 6 nM Oregon Green (pH 7.4) at 22°C.
Figure 6
Figure 6. Effect of TFP on Calcium Binding to CaM1-80 and CaM76-148
Equilibrium calcium titrations of CaM (6 μM) were conducted in the presence of 0 (blue), 6 (green, 1:1), 12 (red, 2:1), 18 (black, 3:1), 24 (cyan, 4:1), or 48 μM (purple, 8:1 TFP:CaM) TFP, and were monitored using the intrinsic fluorescence of CaM. A: phenylalanine fluorescence (250 nmex and 280 nmem). B: tyrosine fluorescence (277 nmex and 320 nmem). In B, for 2:1 and 3:1 TFP:CaM, only the first transition is show. In B, for 4:1 and 8:1 TFP:CaM, the raw signal decreased; it is shown inverted to facilitate comparisons. Solid curves were simulated according to Eq. 3 and free energies in Table 1; bar graph insets represent ΔΔG2 values in Table 1. Inset in Figure 6B are calcium titration of CaM76-148 at 12 μM (red, 2:1 TFP:CaM) and 18 μM (black, 3:1 TFP:CaM) monitored using the intrinsic tyrosine fluorescence of CaM (277 nmex and 320 nmem). Evidence for multiple species, and piecewise analysis described in Results. Solid curves for calcium-dependent increase in fluorescent intensity were simulated according to Eq. 3 and free energies in Table 1; dashed curves correspond to decrease in fluorescence intensity.Solution conditions were 50 mM HEPES, 100 mM KCl, 5 mM KCl, 0.05 mM EGTA, 1 mM MgCl2, and 6 nM Oregon Green (pH 7.4) at 22°C.
Figure 7
Figure 7. TFP-saturated apo and (Ca2+)4-CaM1-148
A. Overlay of 15N-HSQC spectra of apo CaM (black, 2 TFP:CaM) and (Ca2+)4-CaM (red, 4 TFP:CaM). Few peaks overlay, indicating significantly different chemical environments for backbone amides in the structures of apo and (Ca2+)4-CaM saturated by TFP. B. Interdomain interactions in (Ca2+)4-CaM1-148 mediated by TFP. Based on the crystal structure with 4:1 TFP:(Ca2+)4-CaM (1LIN.pdb), the TFP molecule shown in ball-and-stick (brown, with fluorine, sulphur, and nitrogen atoms in green, yellow, and blue respectively) interacts with residues in both the calcium-saturated N-domain (blue) and C-domain (red). Those within 4 Å were residues 8, 11, 72, 92, 144, 145, TFP 1, and TFP 2. (Ca2+)4-CaM backbone (gray), 4 calcium ions (yellow spheres), and three other TFP (gray sticks) are shown. Figure created with Pymol™.
Figure 8
Figure 8. Docking and Models of TFP binding to CaM C-domain
A. TFP Docking to alternative tertiary conformations of apo CaM. Ribbon diagrams of C-domain fragments (residues 82 to 146) represent the “closed” (1DMO.pdb), “semi-open” (2IX7.pdb) and “open” (2HQW, 1LIN.pdb) conformations. Calcium was removed from 2HQW and 1LIN. AutoDock Vina 1.0.3 predicted positions of TFP binding; 20 models having lowest free energy are shown as sticks. The single sulfur atom of each TFP is shown as a sphere; green corresponds to the most favorable free energy of binding; white is the least favorable. Color thermometer below each set of models indicates the range of energies predicted. The TFP molecule observed at site A of 1LIN.pdb is shown in magenta. Residues in calcium-binding sites are yellow; arrows are included only to orient the viewer to chain direction. B. Model of conformational transition of apo C-domain in equilibrium between a “closed” and “semi-open” conformation. Binding of TFP to the blue patches accessible in the “semi-open” conformation is energetically more favorable than binding to “closed” form. TFP binding to the blue occludes hydrophobic patches show in purple of the apo C-domain that are otherwise exposed to solvent. An “open” conformation is adopted upon calcium binding, whether alone or also bound to a drug or protein target exposing hydrophobic patches shown in purple.

Similar articles

Cited by

References

    1. Hidaka H, Ishikawa T. Molecular pharmacology of calmodulin pathways in the cell functions. Cell Calcium. 1992;13:465–472. - PubMed
    1. Newman RA, Van Scyoc WS, Sorensen BR, Jaren OR, Shea MA. Interdomain coopertivity of calmodulin to melittin preferentially increases calcium affinity of sites I and II. Proteins: Structure, Function, and Bioinformatics. 2008;71(4):1792–1812. - PubMed
    1. Sorensen BR, Faga LA, Hultman R, Shea MA. Interdomain linker increases thermostability and decreases calcium affinity of calmodulin N-domain. Biochemistry. 2002;41(1):15–20. - PubMed
    1. Sorensen BR, Shea MA. Interactions between domains of apo calmodulin alter calcium binding and stability. Biochemistry. 1998;37:4244–4253. - PubMed
    1. Zhang M, Tanaka T, Ikura M. Calcium-induced conformational transition revealed by the solution structure of apo calmodulin. Nature Struct Biol. 1995;2:758–767. - PubMed

Publication types

MeSH terms

LinkOut - more resources