. 2010 Jul;19(13):2739-53.
doi: 10.1111/j.1365-294X.2010.04680.x. Epub 2010 Jun 7.

Is local adaptation in Mimulus guttatus caused by trade-offs at individual loci?

Affiliations

Is local adaptation in Mimulus guttatus caused by trade-offs at individual loci?

M C Hall et al. Mol Ecol. 2010 Jul.

Abstract

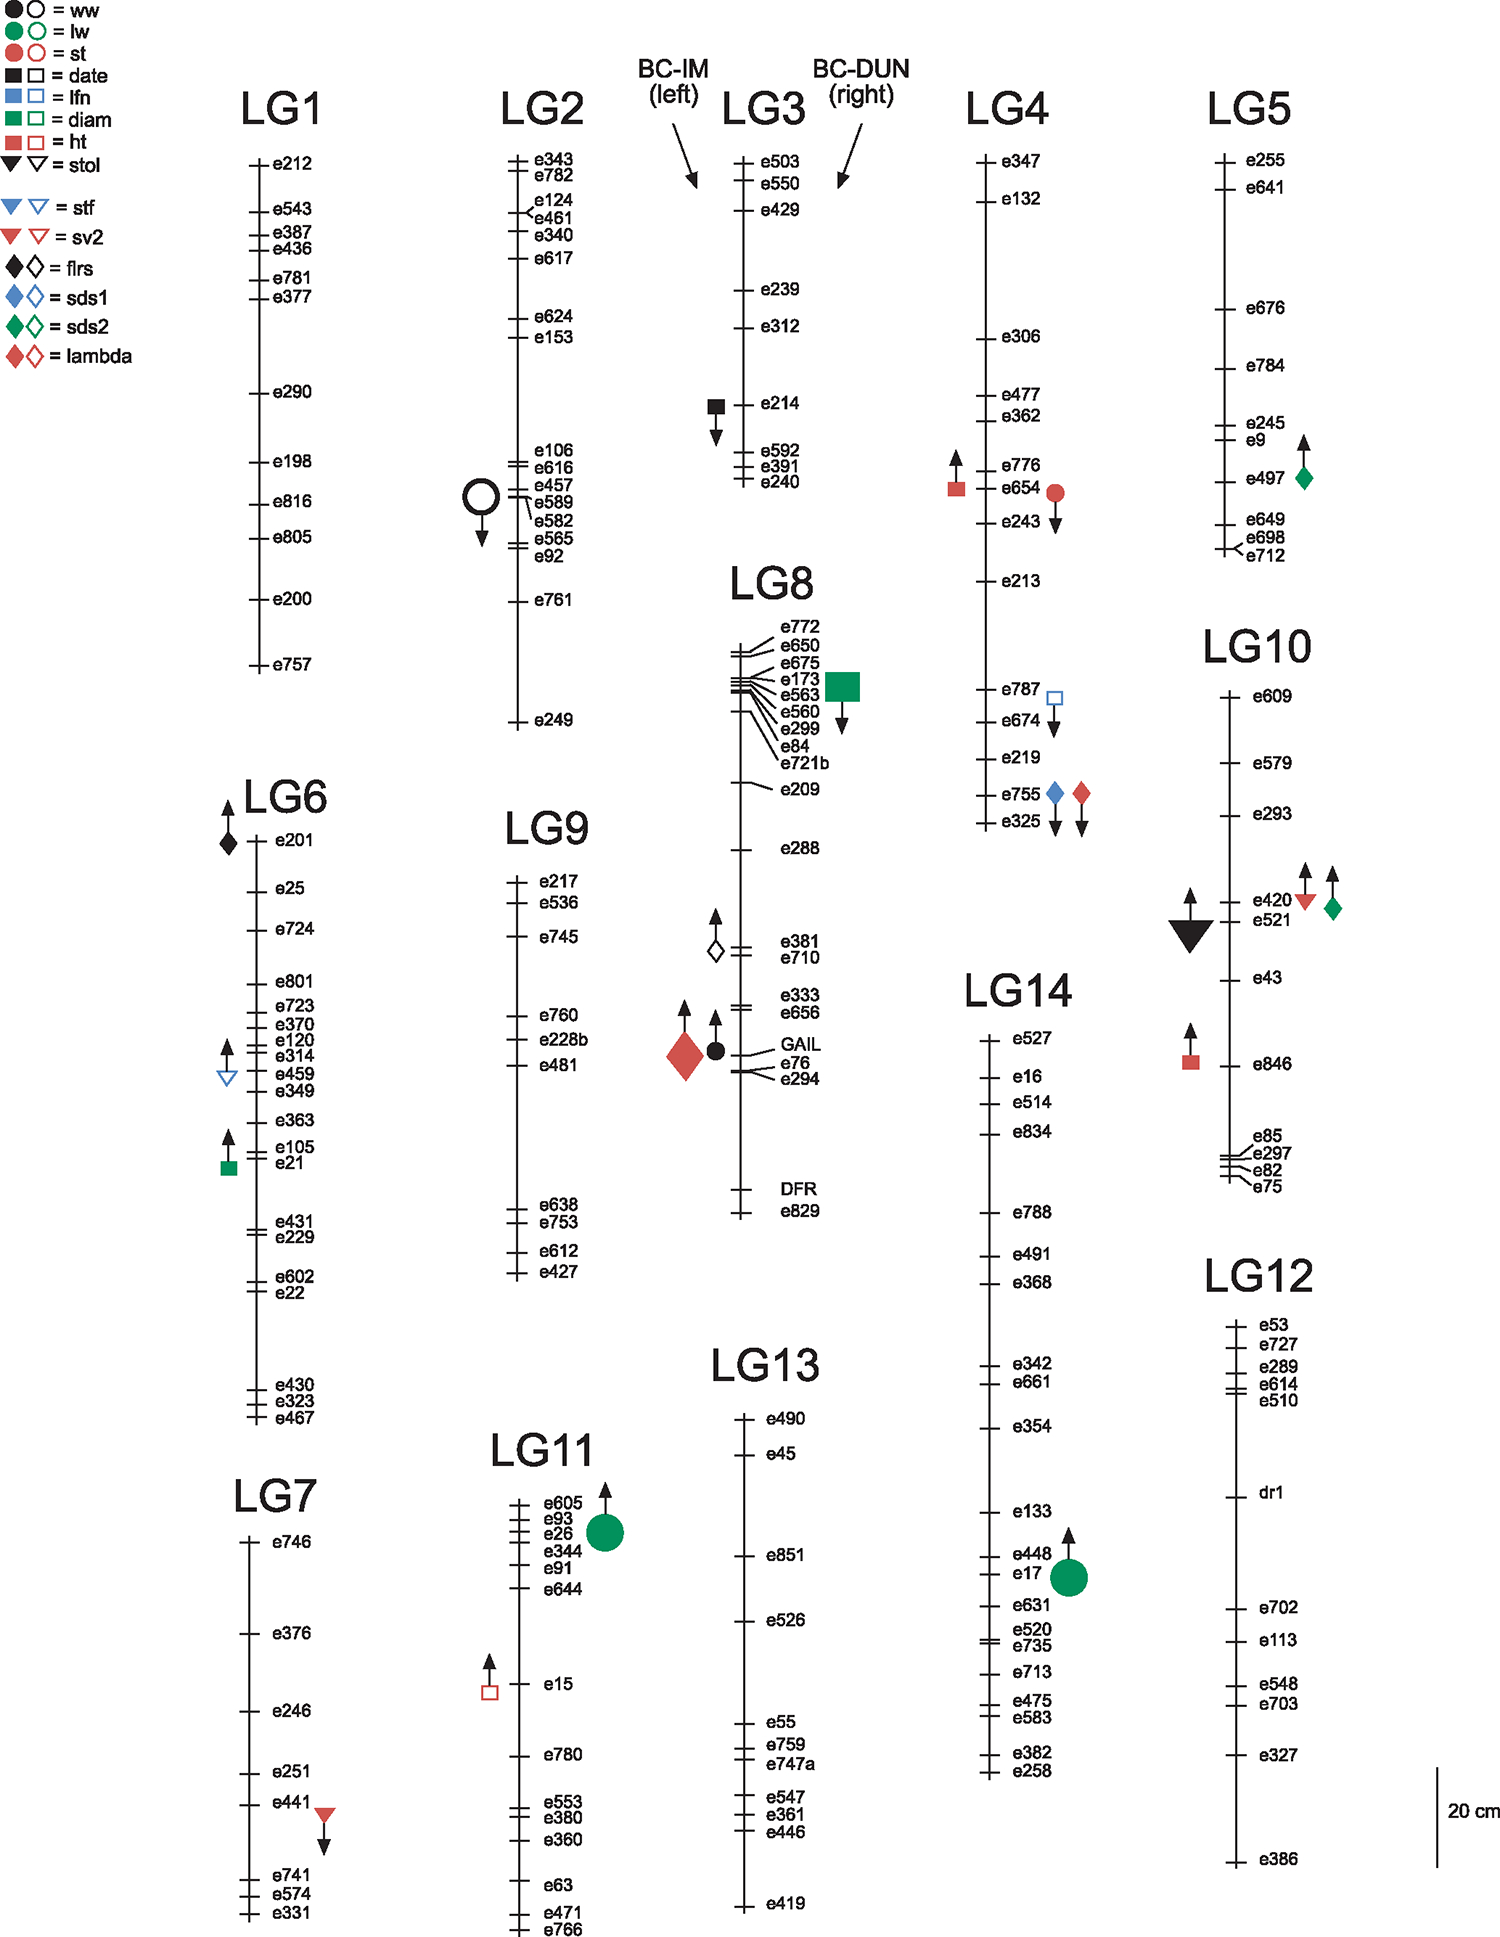
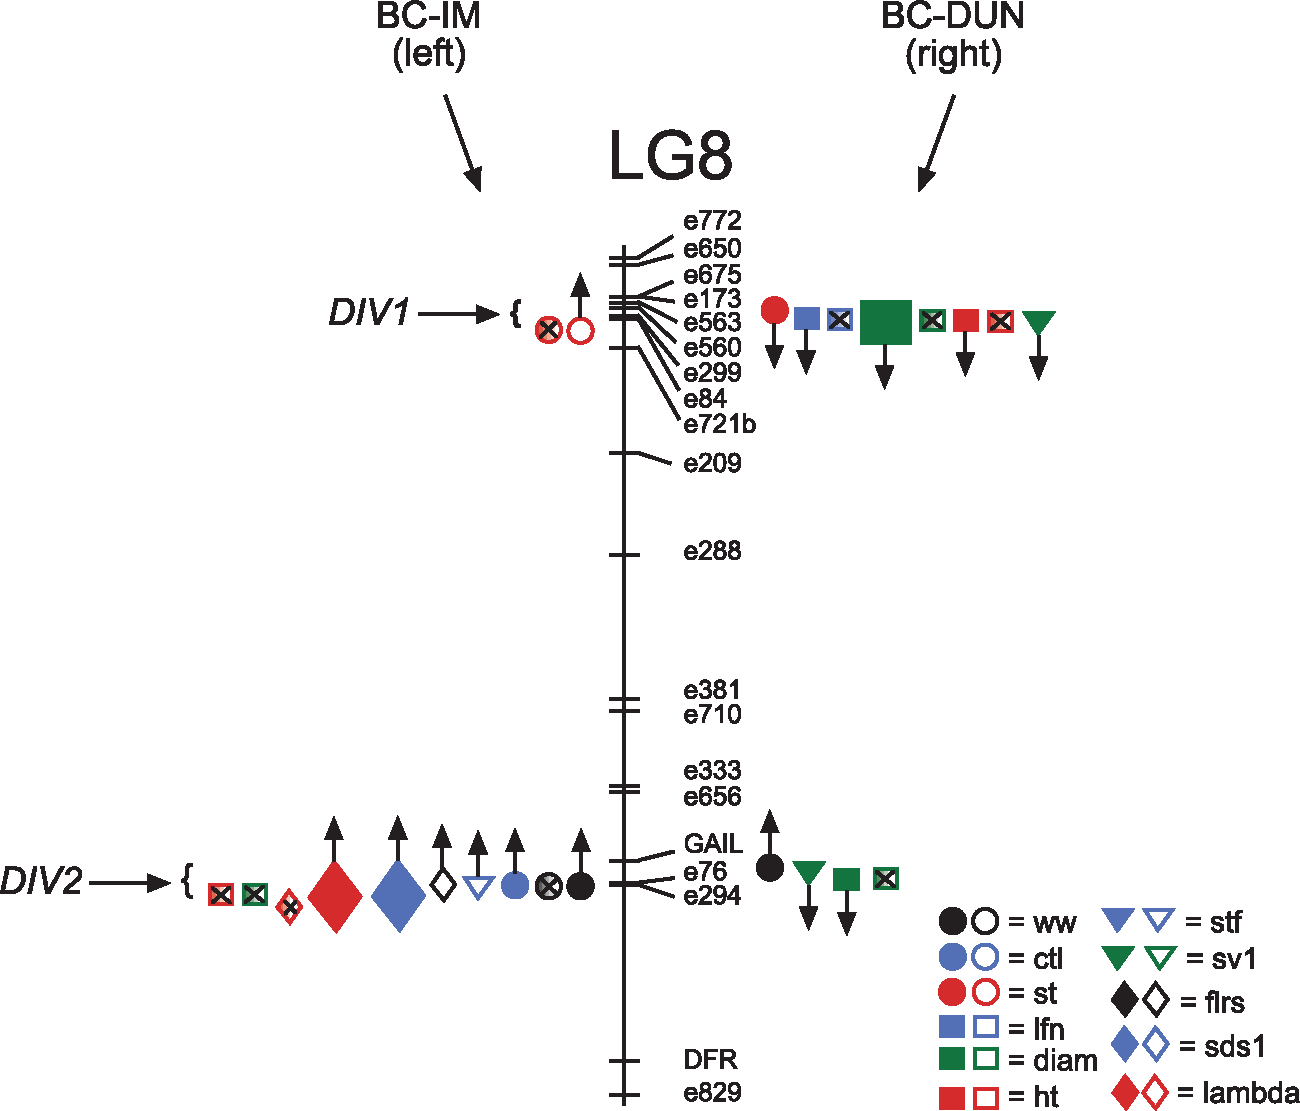
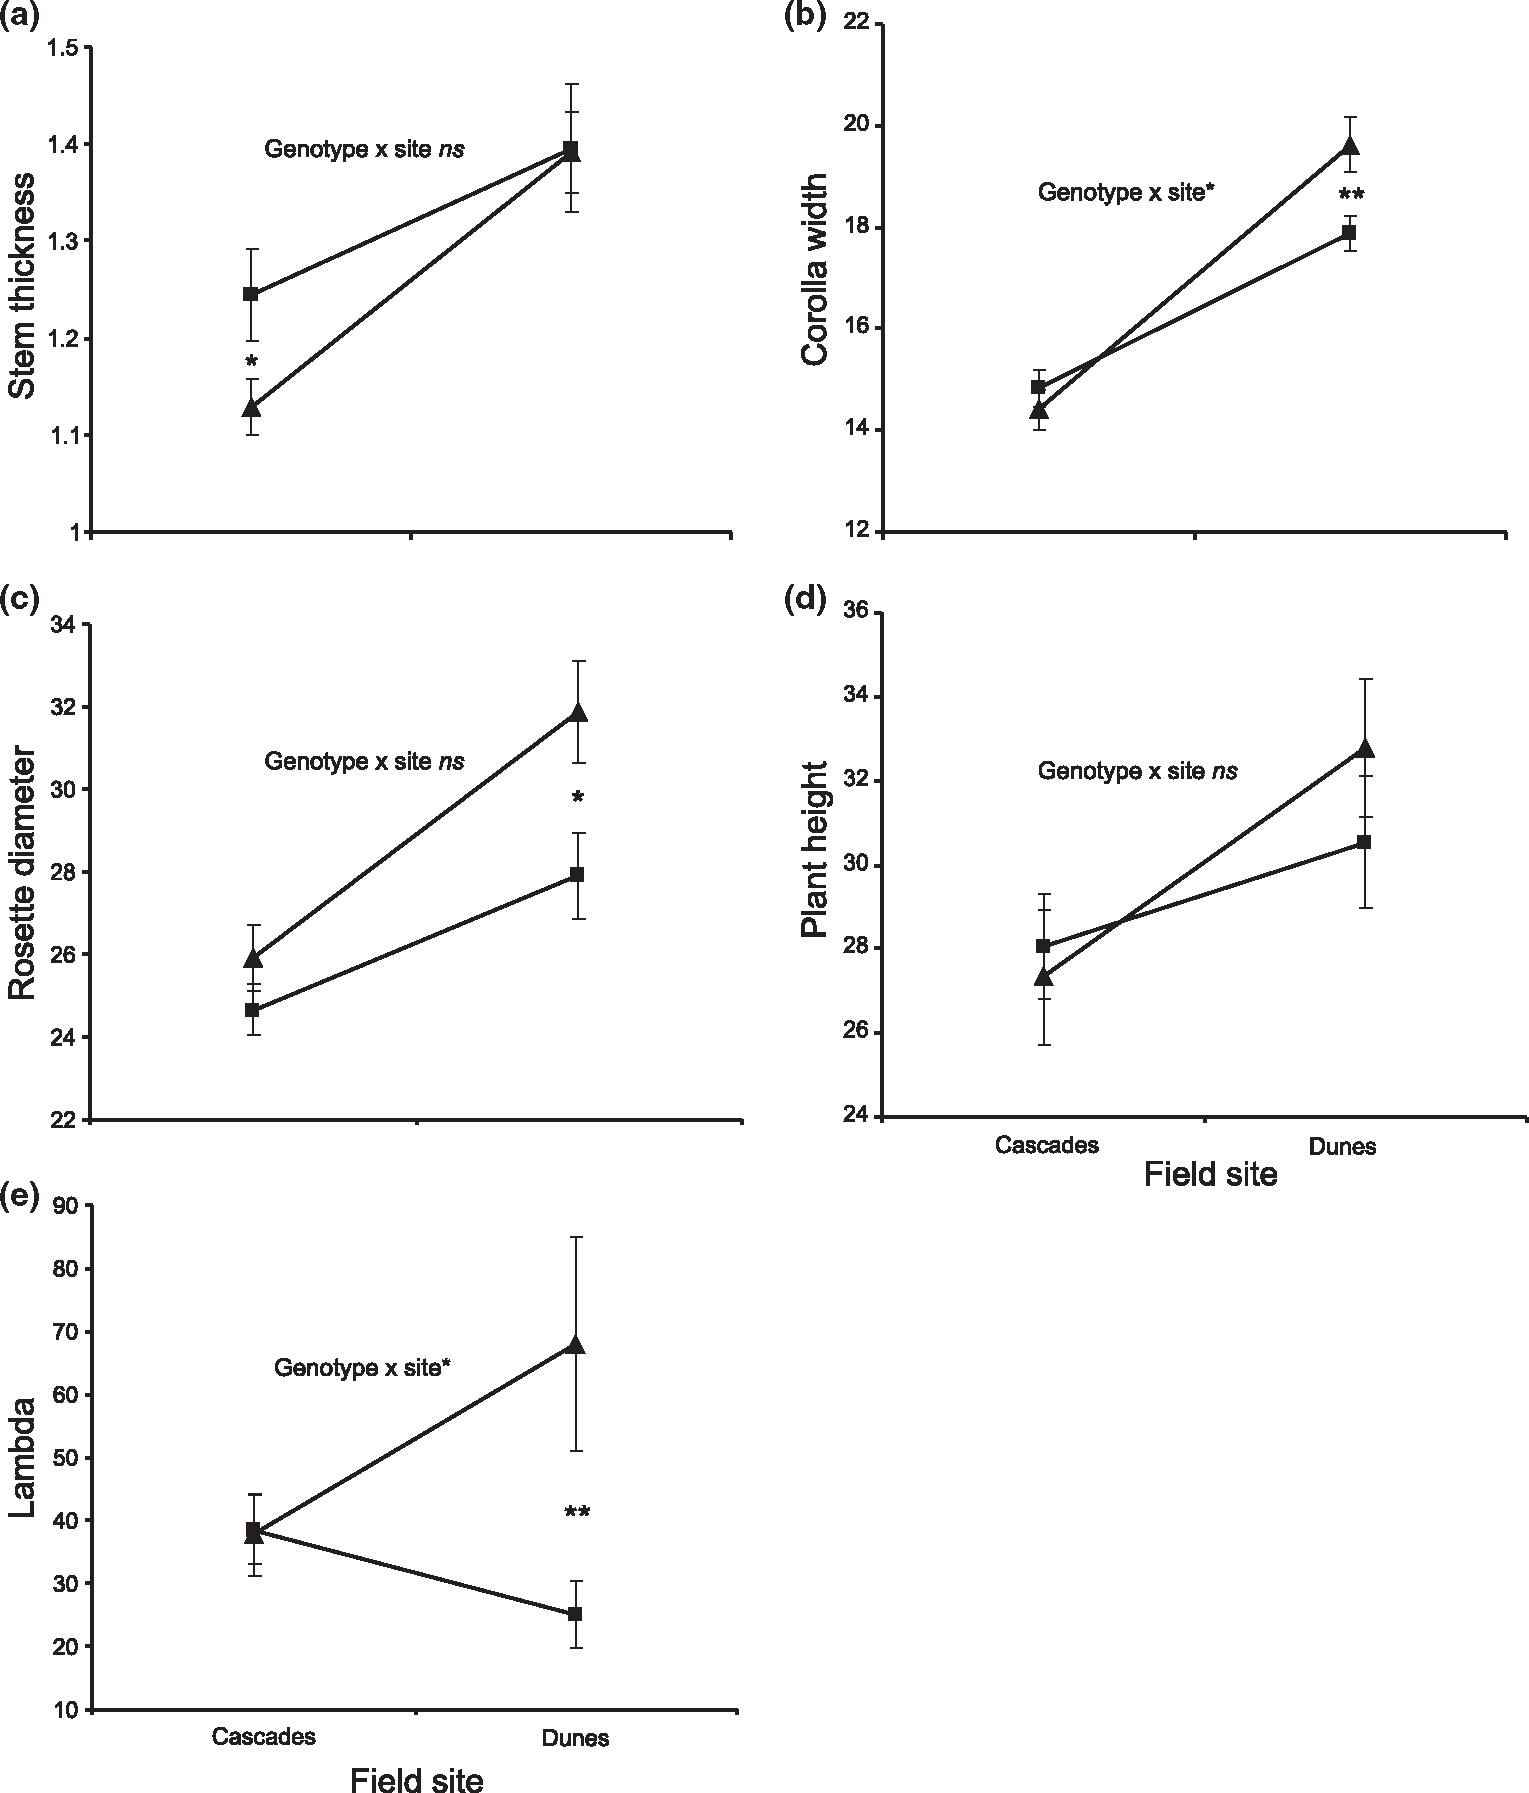
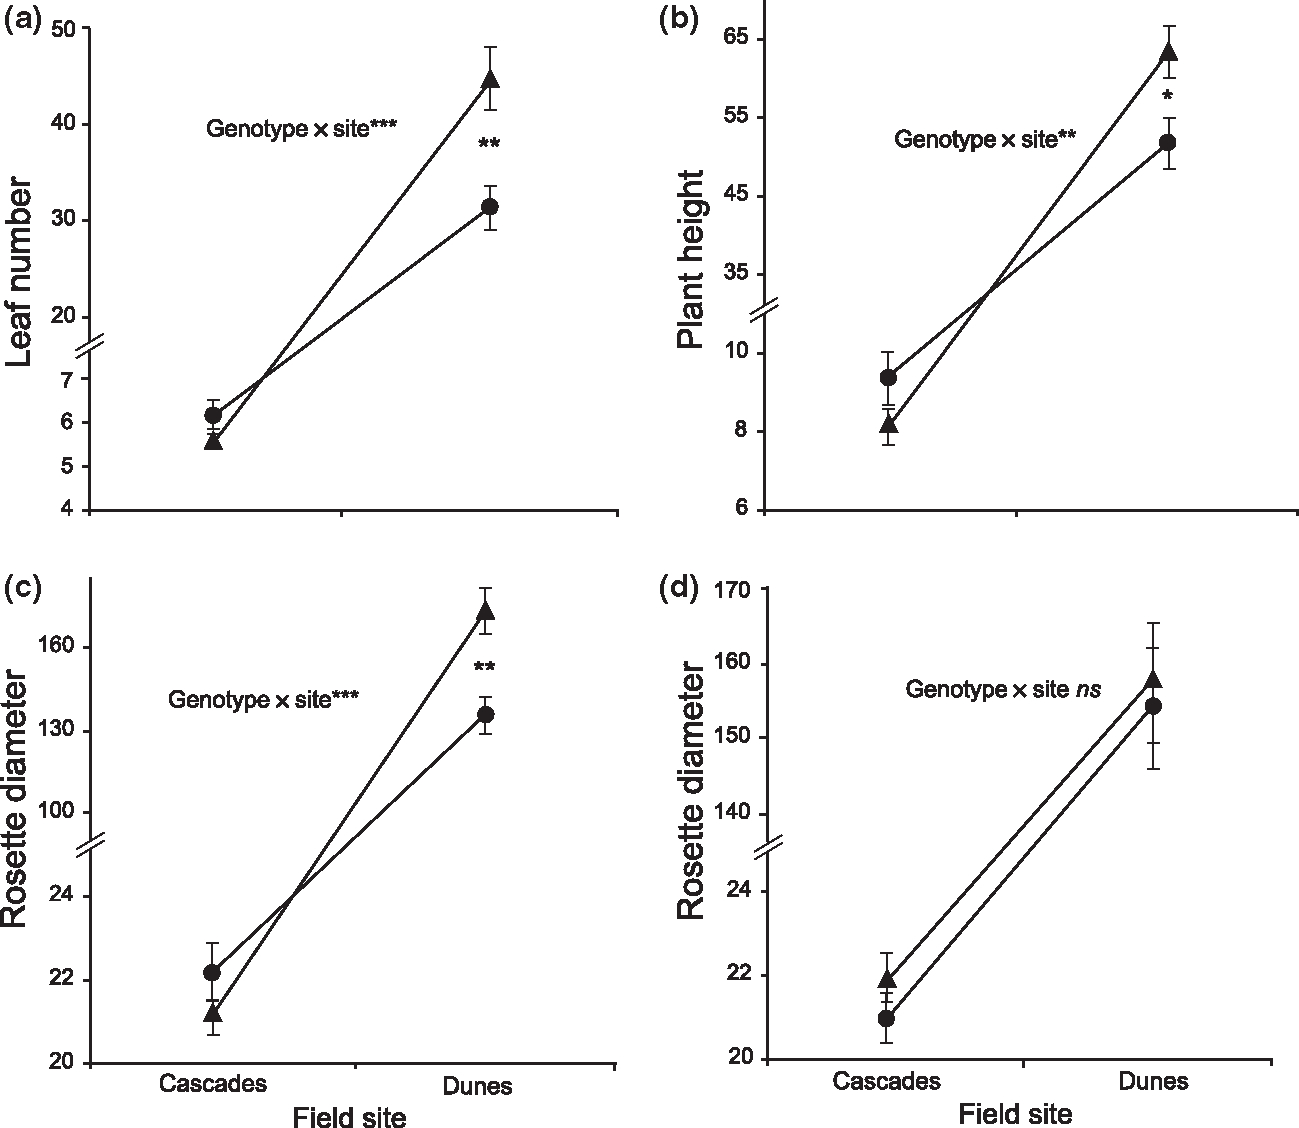
Local adaptation is considered to be the result of fitness trade-offs for particular phenotypes across different habitats. However, it is unclear whether such phenotypic trade-offs exist at the level of individual genetic loci. Local adaptation could arise from trade-offs of alternative alleles at individual loci or by complementary sets of loci with different fitness effects of alleles in one habitat but selective neutrality in the alternative habitat. To evaluate the genome-wide basis of local adaptation, we performed a field-based quantitative trait locus (QTL) mapping experiment on recombinant inbred lines (RILs) created from coastal perennial and inland annual races of the yellow monkeyflower (Mimulus guttatus) grown reciprocally in native parental habitats. Overall, we detected 19 QTLs affecting one or more of 16 traits measured in two environments, most of small effect. We identified 15 additional QTL effects at two previously identified candidate QTLs [DIVERGENCE (DIV)]. Significant QTL by environment interactions were detected at the DIV loci, which was largely attributable to genotypic differences at a single field site. We found no detectable evidence for trade-offs for any one component of fitness, although DIV2 showed a trade-off involving different fitness traits between sites, suggesting that local adaptation is largely controlled by non-overlapping loci. This is surprising for an outcrosser, implying that reduced gene flow prevents the evolution of individuals adapted to multiple environments. We also determined that native genotypes were not uniformly adaptive, possibly reflecting fixed mutational load in one of the populations.


Figures

Fig. 1
Fig. 1
Linkage map of M. guttatus IM × DUN RILs. Locations of significant QTLs affecting BC-IM lines are on the left, BC-DUN on right. Size of symbol indicates the size of the QTL main effect. Small symbols, ME < 1ESD; large symbols, ME > 1. Up arrows indicate that native alleles are favoured (based on results of phenotypic selection analyses; Hall & Willis 2006), down arrows indicate QTLs where foreign alleles have higher fitness than native alleles. Filled symbols indicate a detected QTL effect at the Dunes site, open symbols at the Cascades site. Trait symbols: ww = corolla wide width, ctl = corolla tube length, lw = leaf width, st = stem thickness, date = date of first flower production, lfn = maximum leaf number, diam = maximum plant diameter, ht = maximum plant height, stol = stolon number, stf = survival to flowering, sv1 = survival to end of year 1, sv2 = survival to end of year 2, flrs = total number of flowers produced, sds1 = total seeds produced in year 1, sds2 = total seeds produced in year 2, lambda = total lifetime fitness.
Fig. 2
Fig. 2
Location and effects of candidate QTLs, DIV1 and DIV2, located on Lg8. QTLs with significant QTL by environment interactions between sites are shaded and marked with an ‘x’ to signify an interaction. Locations of significant QTLs affecting BC-IM lines are on the left, BC-DUN on right. Up arrows indicate that native alleles are favoured, down arrows indicate QTLs where foreign alleles have higher fitness than native alleles. Filled symbols indicate a detected QTL effect at the Dunes site, open symbols at the Cascades site. Trait symbols: ww = corolla wide width, ctl = corolla tube length, lw = leaf width, st = stem thickness, date = date of first flower production, lfn = maximum leaf number, diam = maximum plant diameter, ht = maximum plant height, stol = stolon number, stf = survival to flowering, sv1 = survival to end of year 1, sv2 = survival to end of year 2, flrs = total number of flowers produced, sds1 = total seeds produced in year 1, sds2 = total seeds produced in year 2, λ = total lifetime fitness.
Fig. 3
Fig. 3
Mean (±SE) trait values for different genotypes measured in the two field environments for BC-IM lines at candidate markers DIV1 and DIV2 linked to the significant QTL peak detected in MCIM analysis. DIV1 and DIV2 represent the composite genetic effect all of linked loci spanning these QTLs. All size traits are in mm. Allelic effect of markers: (a) DIV1, (b–e) DIV2. Significant genotype × site interactions based on ANOVA (Table 5) at above markers are indicated. ns = not significant, *P < 0.05, **P < 0.01, ***P < 0.001. Differences between genotypes at a single site were tested using t-tests and only significant results (as indicated by P values) are shown. Significant t-test results for: (a) stem thickness at the Cascades site (DIV1), t103 = 2.20 (P = 0.030); (b) corolla width at the Dunes site (DIV2), t141 = −2.88 (P = 0.0046); (c) rosette diameter at the Dunes site (DIV2), t161 = −2.37 (P = 0.0188); e) lambda at the Dunes site (DIV2), t163 = −2.95 (P = 0.0036). ■ = IM/IM homozygotes, ▲ = IM/DUN heterozygotes.
Fig. 4
Fig. 4
Mean (±SE) trait values for different genotypes measured in the two field environments for BC-DUN lines at candidate markers DIV1 and DIV2 linked to the significant QTL peak detected in MCIM analysis. DIV1 and DIV2 represent the composite genetic effect all of linked loci spanning these QTLs. All size traits are in mm. Allelic effect of markers: (a–c) DIV1, (d) DIV2. Significant genotype × site interactions based on ANOVA (Table 5) at above markers are indicated. ns = not significant, *P < 0.05, **P < 0.01, ***P < 0.001. Differences between genotypes at a single site were tested using t-tests and only significant results (as indicated by P values) are shown. Significant t-test results for: (a) leaf number at the Dunes site (DIV1), t173 = 3.23 (P = 0.0015); (b) plant height at the Dunes site (DIV1), t173 = 2.44 (P = 0.0157); (c) rosette diameter at the Dunes site (DIV1), t173 = 3.36 (P = 0.0010). ● = DUN/DUN homozygotes, ▲= IM/DUN heterozygotes.

References

    1. Anastasiou E, Lenhard M (2007) Growing up to one’s standard. Current Opinion in Plant Biology, 10, 63–69. - PubMed
    1. Basten CJ, Weir BS, Zeng ZB (2002) QTL Cartographer: A Reference Manual and Tutorial for QTL Mapping. Department of Statistics, North Carolina State University, Raleigh, NC.
    1. Bogre L, Magyar Z, Lopez-Juez E (2008) New clues to organ size control in plants. Genome Biology, 9, 226. - PMC - PubMed
    1. Bradshaw HD, Schemske DW (2003) Allele substitution at a flower colour locus produces a pollinator shift in monkeyflowers. Nature, 426, 176–178. - PubMed
    1. Busov VB, Brunner AM, Strauss SH (2008) Genes for control of plant stature and form. The New Phytologist, 177, 589–607. - PubMed

Publication types

LinkOut - more resources