

Neutropenia dynamics in a case of T-LGL lymphoproliferation illustrate rapid turnover of granulocyte progenitors
- PMID: 20546248
- PMCID: PMC6495143
- DOI: 10.1111/j.1365-2184.2010.00678.x
Neutropenia dynamics in a case of T-LGL lymphoproliferation illustrate rapid turnover of granulocyte progenitors
Abstract
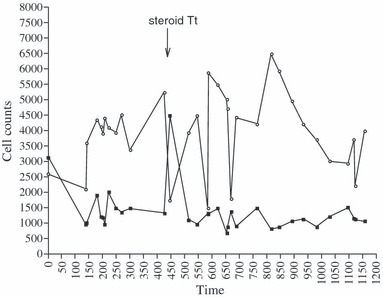
Objectives: To elucidate the natural history of T-cell large granular lymphocyte (T-LGL) lymphoproliferation, we followed changes in associated fluctuating neutropenia for 3 years in an untreated patient presenting with the disease.
Materials and methods: We report a nonlinear mathematical analysis of irregular neutrophil fluctuation, using iterative data maps, to detect long-term regulation of the neutrophil population.
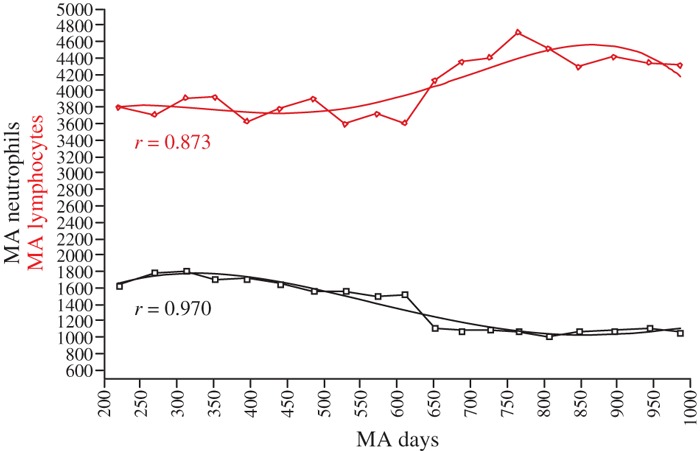
Results: This geometric analysis indicated that variations of this sequence of neutrophil counts followed bounded deterministic dynamics around a fixed low level equilibrium, a situation similar to that previously observed for cultured mouse early bone marrow progenitor cells.
Conclusion: These findings illustrate how the deleterious effect of T-LGL on neutrophils is balanced, over periods of years, by pulses of compensatory neutrophil production, potentially accounting for the commonly observed prolonged indolent course of the disease.
Figures

Similar articles
-
Characteristics of T-cell large granular lymphocyte proliferations associated with neutropenia and inflammatory arthropathy.Arthritis Res Ther. 2008;10(3):R55. doi: 10.1186/ar2424. Epub 2008 May 12. Arthritis Res Ther. 2008. PMID: 18474096 Free PMC article.
-
CD8+, CD57+ T cells from healthy elderly subjects suppress neutrophil development in vitro: implications for the neutropenia of Felty's and large granular lymphocyte syndromes.Arthritis Rheum. 2000 Apr;43(4):834-43. doi: 10.1002/1529-0131(200004)43:4<834::AID-ANR14>3.0.CO;2-H. Arthritis Rheum. 2000. PMID: 10765928
-
Neutropenia associated with T-cell large granular lymphocyte leukemia: long-term response to cyclosporine therapy despite persistence of abnormal cells.Blood. 1998 May 1;91(9):3372-8. Blood. 1998. PMID: 9558395
-
Pathophysiologic mechanisms and management of neutropenia associated with large granular lymphocytic leukemia.Expert Rev Hematol. 2011 Jun;4(3):317-28. doi: 10.1586/ehm.11.26. Expert Rev Hematol. 2011. PMID: 21668396 Review.
-
Chronic neutropenia in LGL leukemia and rheumatoid arthritis.Hematology Am Soc Hematol Educ Program. 2017 Dec 8;2017(1):181-186. doi: 10.1182/asheducation-2017.1.181. Hematology Am Soc Hematol Educ Program. 2017. PMID: 29222254 Free PMC article. Review.
Cited by
-
Neutropenia and Large Granular Lymphocyte Leukemia: From Pathogenesis to Therapeutic Options.Cells. 2021 Oct 19;10(10):2800. doi: 10.3390/cells10102800. Cells. 2021. PMID: 34685780 Free PMC article. Review.
-
Unmasking chaotic attributes in time series of living cell populations.PLoS One. 2010 Feb 22;5(2):e9346. doi: 10.1371/journal.pone.0009346. PLoS One. 2010. PMID: 20179755 Free PMC article.
References
-
- Rose MG, Berliner N (2004) T‐cell large granular lymphocyte leukemia and related disorders. Oncologist 9, 247–258. - PubMed
-
- Morley AA (1966) A neutrophil cycle in healthy individuals. The Lancet 3, 1220–1222. - PubMed
-
- Von Schultess GK, Gessner U (1986) Oscillating platelet counts in healthy individuals: experimental investigation and quantitative evaluation of thrombocytopoietic feedback control. Scand. J. Haematol. 36, 473–479. - PubMed
-
- Maughan WZ, Bishop CR, Pryor TA, Athens JW (1973) The question of cycling of the blood neutrophil concentrations and pitfalls in the statistical analysis of sampled data. Blood 41, 85–91. - PubMed
Publication types
MeSH terms
LinkOut - more resources
Full Text Sources
Medical
