

CONAN: copy number variation analysis software for genome-wide association studies
- PMID: 20546565
- PMCID: PMC2894823
- DOI: 10.1186/1471-2105-11-318
CONAN: copy number variation analysis software for genome-wide association studies
Abstract
Background: Genome-wide association studies (GWAS) based on single nucleotide polymorphisms (SNPs) revolutionized our perception of the genetic regulation of complex traits and diseases. Copy number variations (CNVs) promise to shed additional light on the genetic basis of monogenic as well as complex diseases and phenotypes. Indeed, the number of detected associations between CNVs and certain phenotypes are constantly increasing. However, while several software packages support the determination of CNVs from SNP chip data, the downstream statistical inference of CNV-phenotype associations is still subject to complicated and inefficient in-house solutions, thus strongly limiting the performance of GWAS based on CNVs.
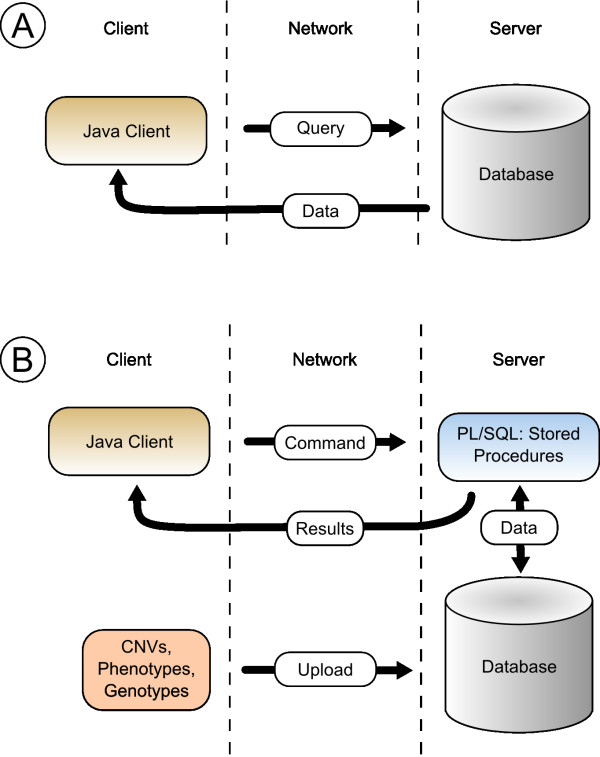
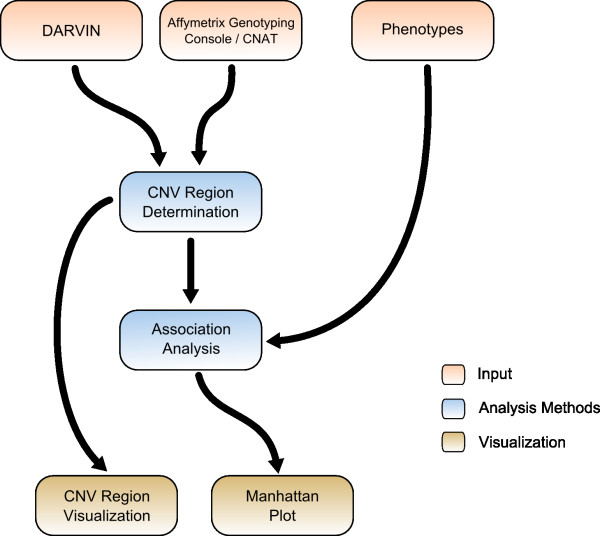
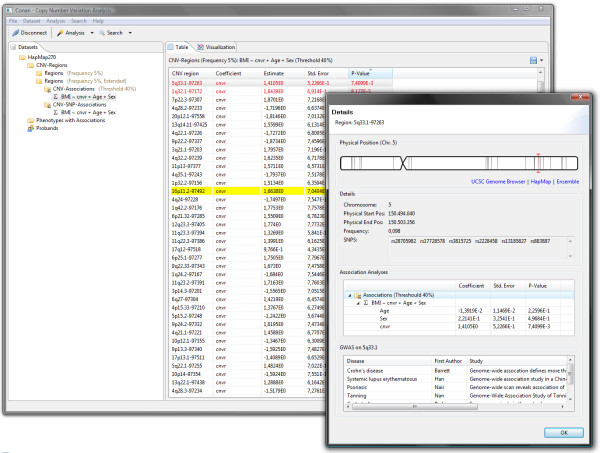
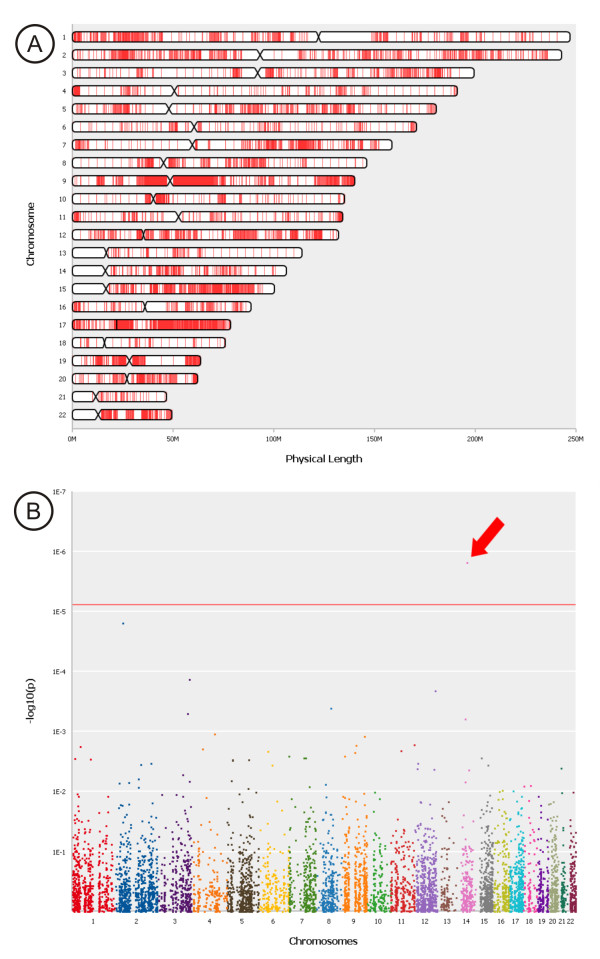
Results: CONAN is a freely available client-server software solution which provides an intuitive graphical user interface for categorizing, analyzing and associating CNVs with phenotypes. Moreover, CONAN assists the evaluation process by visualizing detected associations via Manhattan plots in order to enable a rapid identification of genome-wide significant CNV regions. Various file formats including the information on CNVs in population samples are supported as input data.
Conclusions: CONAN facilitates the performance of GWAS based on CNVs and the visual analysis of calculated results. CONAN provides a rapid, valid and straightforward software solution to identify genetic variation underlying the 'missing' heritability for complex traits that remains unexplained by recent GWAS. The freely available software can be downloaded at http://genepi-conan.i-med.ac.at.
Figures
Similar articles
-
The coexistence of copy number variations (CNVs) and single nucleotide polymorphisms (SNPs) at a locus can result in distorted calculations of the significance in associating SNPs to disease.Hum Genet. 2018 Jul;137(6-7):553-567. doi: 10.1007/s00439-018-1910-3. Epub 2018 Jul 17. Hum Genet. 2018. PMID: 30019117 Free PMC article.
-
Genome-wide association study of copy number variation with lung function identifies a novel signal of association near BANP for forced vital capacity.BMC Genet. 2016 Aug 11;17(1):116. doi: 10.1186/s12863-016-0423-0. BMC Genet. 2016. PMID: 27514831 Free PMC article.
-
Genome-wide algorithm for detecting CNV associations with diseases.BMC Bioinformatics. 2011 Aug 9;12:331. doi: 10.1186/1471-2105-12-331. BMC Bioinformatics. 2011. PMID: 21827692 Free PMC article.
-
Implications of germline copy-number variations in psychiatric disorders: review of large-scale genetic studies.J Hum Genet. 2021 Jan;66(1):25-37. doi: 10.1038/s10038-020-00838-1. Epub 2020 Sep 21. J Hum Genet. 2021. PMID: 32958875 Review.
-
The impact of human copy number variation on gene expression.Brief Funct Genomics. 2015 Sep;14(5):352-7. doi: 10.1093/bfgp/elv017. Epub 2015 Apr 27. Brief Funct Genomics. 2015. PMID: 25922366 Free PMC article. Review.
Cited by
-
CNVDeep: deep association of copy number variants with neurocognitive disorders.BMC Bioinformatics. 2024 Aug 29;25(1):283. doi: 10.1186/s12859-024-05874-8. BMC Bioinformatics. 2024. PMID: 39210319 Free PMC article.
-
Rapid visualisation of microarray copy number data for the detection of structural variations linked to a disease phenotype.PLoS One. 2012;7(8):e43466. doi: 10.1371/journal.pone.0043466. Epub 2012 Aug 17. PLoS One. 2012. PMID: 22912880 Free PMC article.
-
In silico analysis of several frequent SLX4 mutations appearing in human cancers.MicroPubl Biol. 2024 May 17;2024:10.17912/micropub.biology.001216. doi: 10.17912/micropub.biology.001216. eCollection 2024. MicroPubl Biol. 2024. PMID: 38828439 Free PMC article.
-
Detection of genome-wide copy number variations in two chicken lines divergently selected for abdominal fat content.BMC Genomics. 2014 Jun 24;15:517. doi: 10.1186/1471-2164-15-517. BMC Genomics. 2014. PMID: 24962627 Free PMC article.
-
Improving genetic risk prediction by leveraging pleiotropy.Hum Genet. 2014 May;133(5):639-50. doi: 10.1007/s00439-013-1401-5. Epub 2013 Dec 13. Hum Genet. 2014. PMID: 24337655 Free PMC article.
References
Publication types
MeSH terms
LinkOut - more resources
Full Text Sources
Other Literature Sources
