

An application of Random Forests to a genome-wide association dataset: methodological considerations & new findings
- PMID: 20546594
- PMCID: PMC2896336
- DOI: 10.1186/1471-2156-11-49
An application of Random Forests to a genome-wide association dataset: methodological considerations & new findings
Abstract
Background: As computational power improves, the application of more advanced machine learning techniques to the analysis of large genome-wide association (GWA) datasets becomes possible. While most traditional statistical methods can only elucidate main effects of genetic variants on risk for disease, certain machine learning approaches are particularly suited to discover higher order and non-linear effects. One such approach is the Random Forests (RF) algorithm. The use of RF for SNP discovery related to human disease has grown in recent years; however, most work has focused on small datasets or simulation studies which are limited.
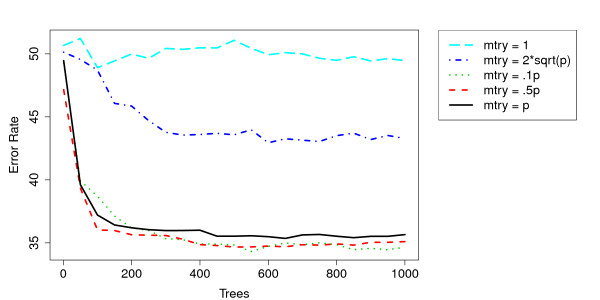
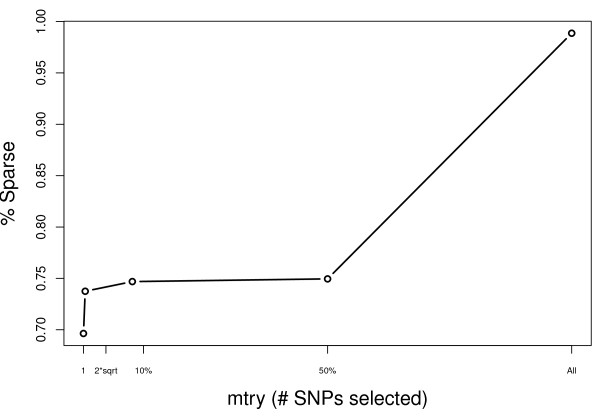
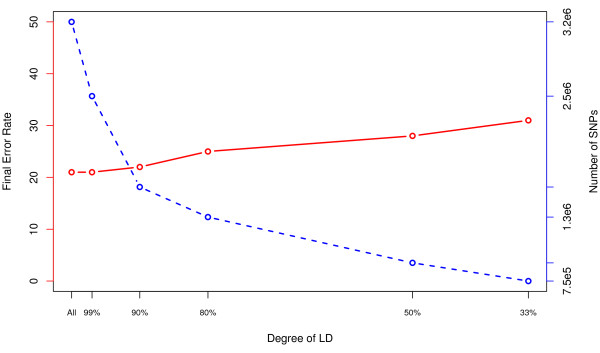
Results: Using a multiple sclerosis (MS) case-control dataset comprised of 300 K SNP genotypes across the genome, we outline an approach and some considerations for optimally tuning the RF algorithm based on the empirical dataset. Importantly, results show that typical default parameter values are not appropriate for large GWA datasets. Furthermore, gains can be made by sub-sampling the data, pruning based on linkage disequilibrium (LD), and removing strong effects from RF analyses. The new RF results are compared to findings from the original MS GWA study and demonstrate overlap. In addition, four new interesting candidate MS genes are identified, MPHOSPH9, CTNNA3, PHACTR2 and IL7, by RF analysis and warrant further follow-up in independent studies.
Conclusions: This study presents one of the first illustrations of successfully analyzing GWA data with a machine learning algorithm. It is shown that RF is computationally feasible for GWA data and the results obtained make biologic sense based on previous studies. More importantly, new genes were identified as potentially being associated with MS, suggesting new avenues of investigation for this complex disease.
Figures
Similar articles
-
Genome-wide association data classification and SNPs selection using two-stage quality-based Random Forests.BMC Genomics. 2015;16 Suppl 2(Suppl 2):S5. doi: 10.1186/1471-2164-16-S2-S5. Epub 2015 Jan 21. BMC Genomics. 2015. PMID: 25708662 Free PMC article.
-
SNP selection and classification of genome-wide SNP data using stratified sampling random forests.IEEE Trans Nanobioscience. 2012 Sep;11(3):216-27. doi: 10.1109/TNB.2012.2214232. IEEE Trans Nanobioscience. 2012. PMID: 22987127
-
Random Forests approach for identifying additive and epistatic single nucleotide polymorphisms associated with residual feed intake in dairy cattle.J Dairy Sci. 2013 Oct;96(10):6716-29. doi: 10.3168/jds.2012-6237. Epub 2013 Aug 9. J Dairy Sci. 2013. PMID: 23932129
-
Random forests for genetic association studies.Stat Appl Genet Mol Biol. 2011;10(1):32. doi: 10.2202/1544-6115.1691. Epub 2011 Jul 12. Stat Appl Genet Mol Biol. 2011. PMID: 22889876 Free PMC article. Review.
-
Multigenic modeling of complex disease by random forests.Adv Genet. 2010;72:73-99. doi: 10.1016/B978-0-12-380862-2.00004-7. Adv Genet. 2010. PMID: 21029849 Review.
Cited by
-
Detection of Hereditary 1,25-Hydroxyvitamin D-Resistant Rickets Caused by Uniparental Disomy of Chromosome 12 Using Genome-Wide Single Nucleotide Polymorphism Array.PLoS One. 2015 Jul 8;10(7):e0131157. doi: 10.1371/journal.pone.0131157. eCollection 2015. PLoS One. 2015. PMID: 26153892 Free PMC article.
-
On the overestimation of random forest's out-of-bag error.PLoS One. 2018 Aug 6;13(8):e0201904. doi: 10.1371/journal.pone.0201904. eCollection 2018. PLoS One. 2018. PMID: 30080866 Free PMC article.
-
Targeted Metabolomics Analysis Suggests That Tacrolimus Alters Protection against Oxidative Stress.Antioxidants (Basel). 2023 Jul 12;12(7):1412. doi: 10.3390/antiox12071412. Antioxidants (Basel). 2023. PMID: 37507951 Free PMC article.
-
KLFDAPC: a supervised machine learning approach for spatial genetic structure analysis.Brief Bioinform. 2022 Jul 18;23(4):bbac202. doi: 10.1093/bib/bbac202. Brief Bioinform. 2022. PMID: 35649387 Free PMC article.
-
Exploiting SNP correlations within random forest for genome-wide association studies.PLoS One. 2014 Apr 2;9(4):e93379. doi: 10.1371/journal.pone.0093379. eCollection 2014. PLoS One. 2014. PMID: 24695491 Free PMC article.
References
Publication types
MeSH terms
Grants and funding
- MH 63420/MH/NIMH NIH HHS/United States
- MH60870/MH/NIMH NIH HHS/United States
- MH59586/MH/NIMH NIH HHS/United States
- MH059571/MH/NIMH NIH HHS/United States
- MH067257/MH/NIMH NIH HHS/United States
- R01NS049510/NS/NINDS NIH HHS/United States
- 076113/Wellcome Trust/United Kingdom
- R01AI076544/AI/NIAID NIH HHS/United States
- MH059565/MH/NIMH NIH HHS/United States
- MH059588/MH/NIMH NIH HHS/United States
- T32 HG 00047/HG/NHGRI NIH HHS/United States
- NS032830/NS/NINDS NIH HHS/United States
- MH59566/MH/NIMH NIH HHS/United States
- R01 NS049477/NS/NINDS NIH HHS/United States
- U01 MH060879/MH/NIMH NIH HHS/United States
- MH59587/MH/NIMH NIH HHS/United States
- G0700061/Medical Research Council/United Kingdom
LinkOut - more resources
Full Text Sources
Other Literature Sources
Research Materials
Miscellaneous
