

Changes in human meibum lipid with meibomian gland dysfunction using principal component analysis
- PMID: 20546726
- PMCID: PMC2914467
- DOI: 10.1016/j.exer.2010.05.014
Changes in human meibum lipid with meibomian gland dysfunction using principal component analysis
Abstract
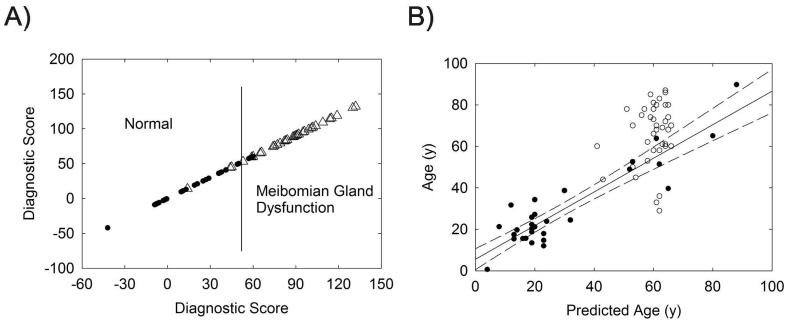
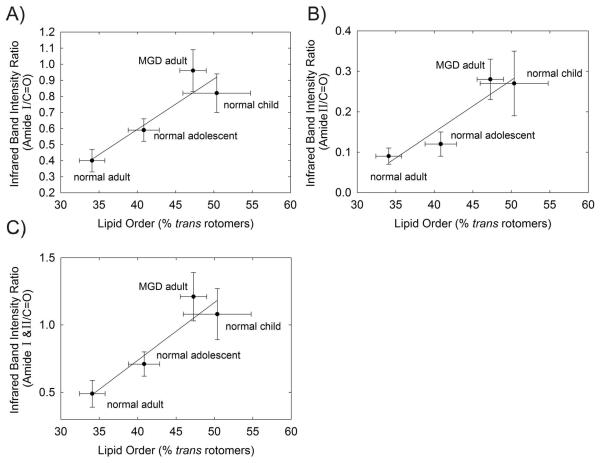
Changes in the phase transition temperatures and conformation of human meibum lipid with age and meibomian gland dysfunction have been quantified but with analysis of less than 1% of the infrared spectral range. The remaining 99% of the spectral range was analyzed with principal component analysis (PCA) and confirms our previous studies and reveal further insights into changes that occur in meibum with age and disease. Infrared spectra of meibum from 41 patients diagnosed with meibomian gland dysfunction (Md) and 32 normal donors (Mn) were measured. Principal component analysis (PCA) was used to quantify the variance among the spectra and meibum protein was quantified using the infrared carbonyl and amide I and II bands. A training set of spectra was used to discriminate between Mn and Md with an accuracy of 93%. This shows that certain spectral regions (eigenvectors) contain compositional and structural information about the changes that occur with the principal component (variable), meibomian gland dysfunction. The spectral features of the major eigenvector indicate that Md contains more protein and relatively less CH(3) and cis = CH band intensity compared to Mn. The amount of protein was confirmed from relative infrared band intensities. Our study supports the idea that compositional differences result in meibum that is less fluid and more viscous with meibomian gland dysfunction so that less lipid flows out of the meibomian gland orifice as observed clinically. This study also demonstrates the power of the combination of infrared spectroscopy and PCA as a diagnostic tool that discriminates between Mn and Md.
Published by Elsevier Ltd.
Figures


Similar articles
-
Human meibum lipid conformation and thermodynamic changes with meibomian-gland dysfunction.Invest Ophthalmol Vis Sci. 2011 Jun 1;52(6):3805-17. doi: 10.1167/iovs.10-6514. Invest Ophthalmol Vis Sci. 2011. PMID: 21398284 Free PMC article. Clinical Trial.
-
Differences in human meibum lipid composition with meibomian gland dysfunction using NMR and principal component analysis.Invest Ophthalmol Vis Sci. 2012 Jan 25;53(1):337-47. doi: 10.1167/iovs.11-8551. Invest Ophthalmol Vis Sci. 2012. PMID: 22131391 Free PMC article.
-
Characterization of human meibum lipid using raman spectroscopy.Curr Eye Res. 2009 Oct;34(10):824-35. doi: 10.3109/02713680903122029. Curr Eye Res. 2009. PMID: 19895310
-
Characterization of expressed human meibum using hyperspectral stimulated Raman scattering microscopy.Ocul Surf. 2019 Jan;17(1):151-159. doi: 10.1016/j.jtos.2018.10.003. Epub 2018 Oct 11. Ocul Surf. 2019. PMID: 30317006 Free PMC article. Review.
-
Meibomian Gland Dysfunction and Contact Lens Discomfort.Eye Contact Lens. 2017 Jan;43(1):17-22. doi: 10.1097/ICL.0000000000000351. Eye Contact Lens. 2017. PMID: 28002224 Review.
Cited by
-
Delineating a novel metabolic high triglycerides-low waxes syndrome that affects lipid homeostasis in meibomian and sebaceous glands.Exp Eye Res. 2020 Oct;199:108189. doi: 10.1016/j.exer.2020.108189. Epub 2020 Aug 15. Exp Eye Res. 2020. PMID: 32805264 Free PMC article.
-
Topical azithromycin and oral doxycycline therapy of meibomian gland dysfunction: a comparative clinical and spectroscopic pilot study.Cornea. 2013 Jan;32(1):44-53. doi: 10.1097/ICO.0b013e318254205f. Cornea. 2013. PMID: 22668581 Free PMC article.
-
Obese Mice with Dyslipidemia Exhibit Meibomian Gland Hypertrophy and Alterations in Meibum Composition and Aqueous Tear Production.Int J Mol Sci. 2020 Nov 20;21(22):8772. doi: 10.3390/ijms21228772. Int J Mol Sci. 2020. PMID: 33233559 Free PMC article.
-
Human Meibum Age, Lipid-Lipid Interactions and Lipid Saturation in Meibum from Infants.Int J Mol Sci. 2017 Aug 28;18(9):1862. doi: 10.3390/ijms18091862. Int J Mol Sci. 2017. PMID: 28846660 Free PMC article.
-
Nonpolar Lipids Contribute to Midday Fogging During Scleral Lens Wear.Invest Ophthalmol Vis Sci. 2023 Jan 3;64(1):7. doi: 10.1167/iovs.64.1.7. Invest Ophthalmol Vis Sci. 2023. PMID: 36630141 Free PMC article.
References
-
- Borchman D, Foulks GN, Yappert MC, et al. Temperature-Induced Conformational Changes in Human Tear Lipids Hydrocarbon Chains. Biopolymers/Biospectroscopy. 2007a;87:124–133. - PubMed
-
- Borchman D, Foulks GN, Yappert MC, et al. Spectroscopic Evaluation of Human Tear Lipids. Chem Phys Lipids. 2007b;147:87–102. - PubMed
-
- Borchman D, Foulks GN, Yappert MC, et al. Human Meibum Lipid Hydrocarbon Chain Conformational and Thermodynamic Changes with Age. Ophthalmic Res. 2010 In Press.
-
- Butovich IA, Uchiyama E, Di Pascuale MA, et al. Liquid chromatography-mass spectrometric analysis of lipids present in human meibomian gland secretions. Lipids. 2007a;42:765–776. - PubMed
-
- Butovich IA, Uchiyama E, McCulley JP. Lipids of human meibum: mass-spectrometric analysis and structural elucidation. J Lipid Res. 2007b;48:2220–2235. - PubMed
Publication types
MeSH terms
Substances
Grants and funding
LinkOut - more resources
Full Text Sources
Other Literature Sources
Medical
