. 2010 Aug 26;43(12):2418-24.
doi: 10.1016/j.jbiomech.2010.04.019. Epub 2010 May 23.

Correlations between local strains and tissue phenotypes in an experimental model of skeletal healing

Affiliations

Correlations between local strains and tissue phenotypes in an experimental model of skeletal healing

Elise F Morgan et al. J Biomech. .

Abstract

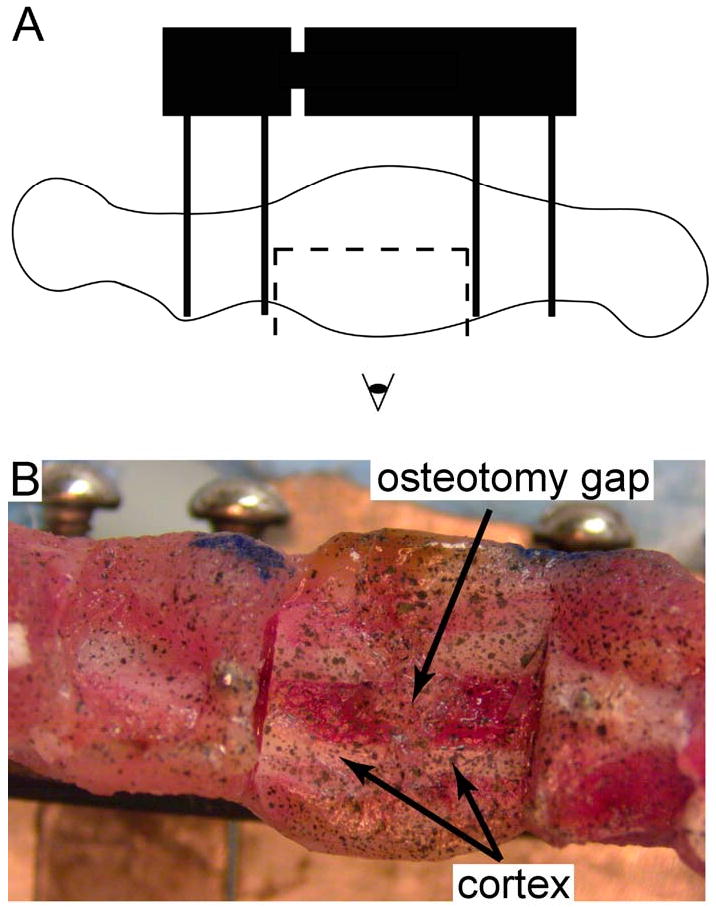
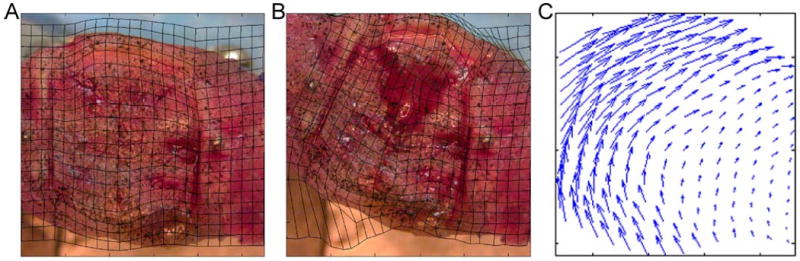
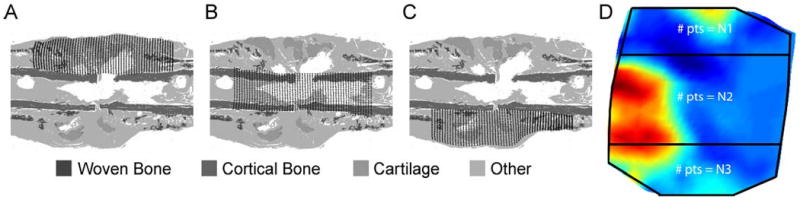
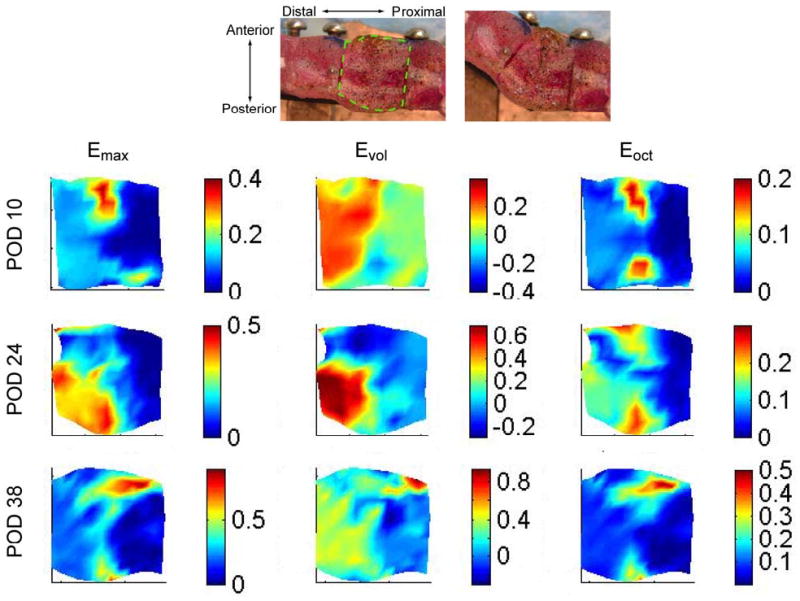
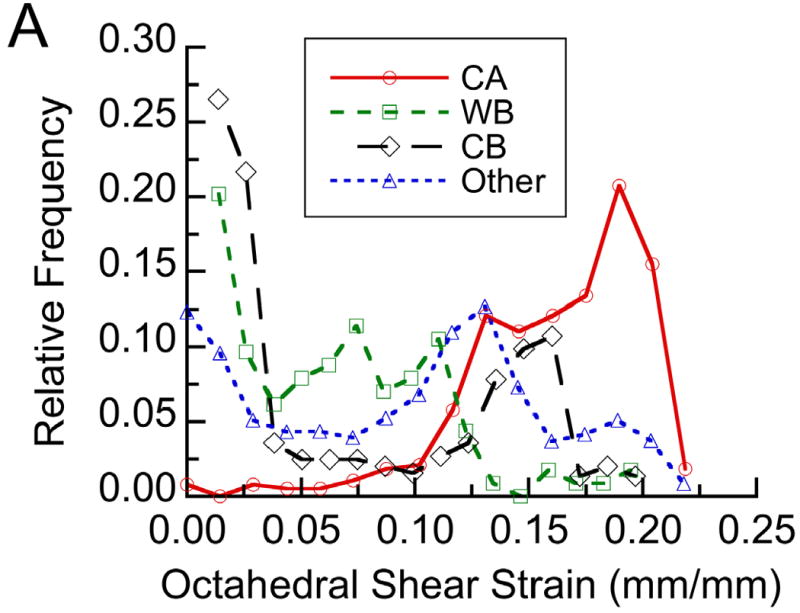
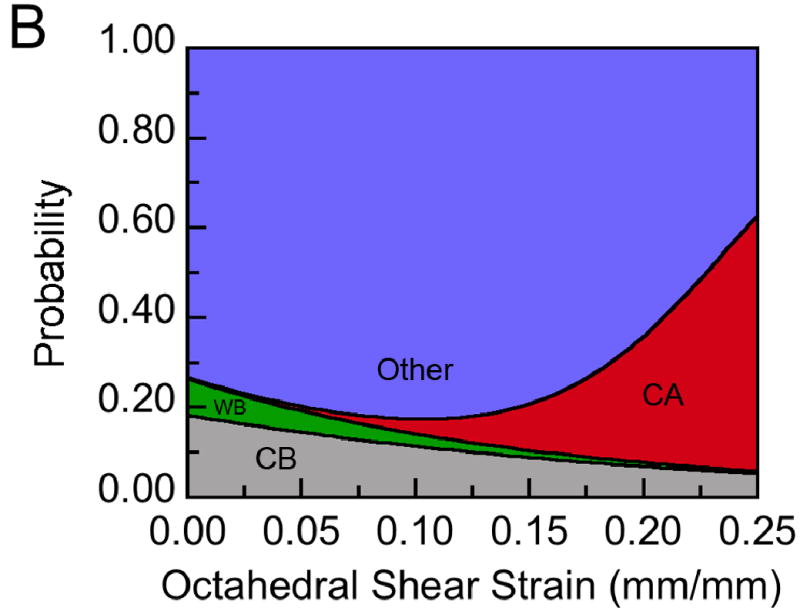
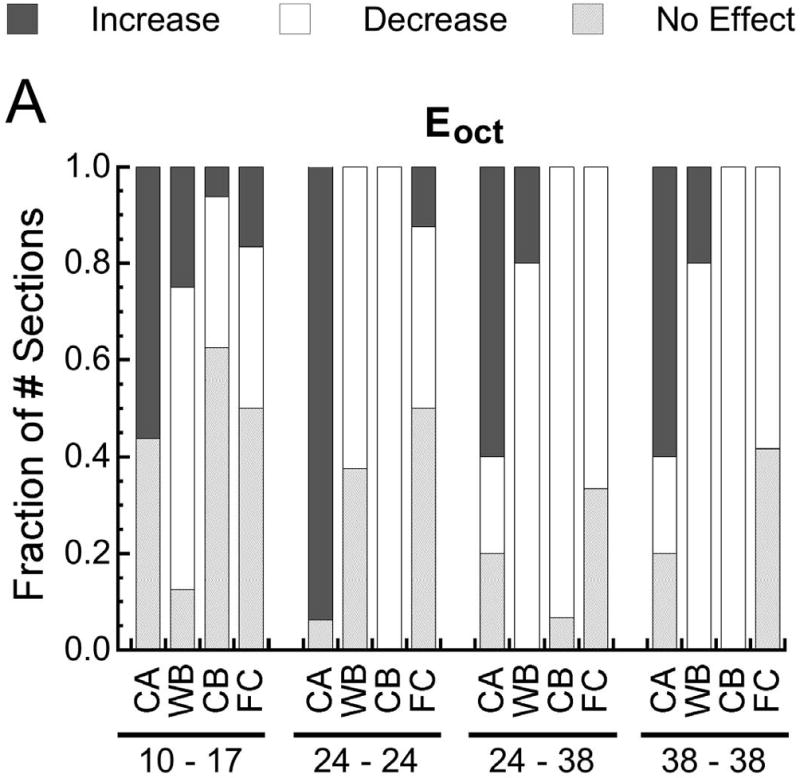
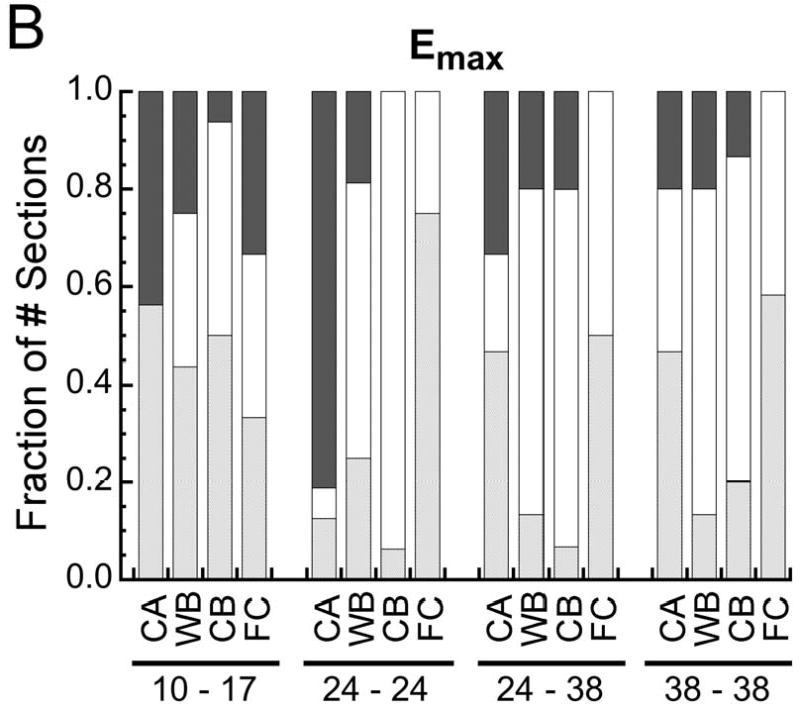
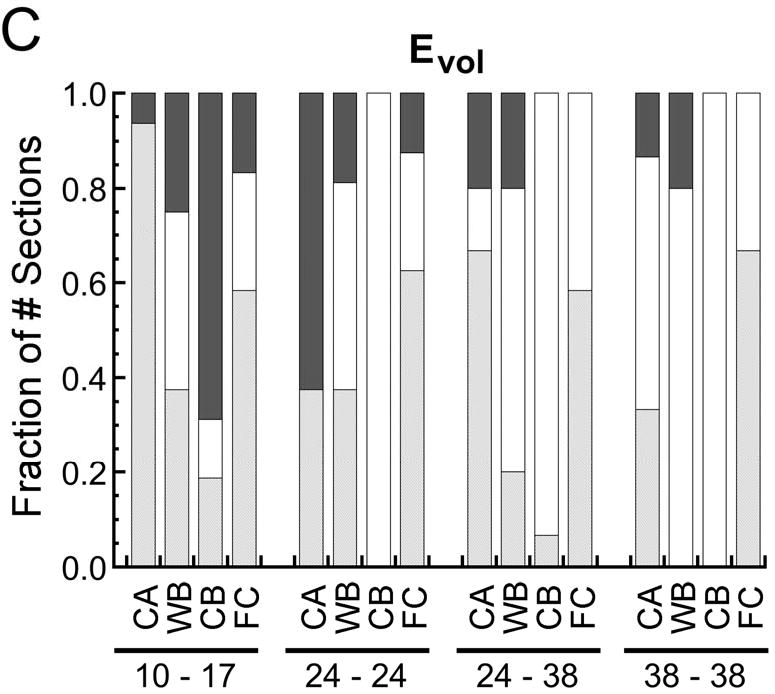
Defining how mechanical cues regulate tissue differentiation during skeletal healing can benefit treatment of orthopaedic injuries and may also provide insight into the influence of the mechanical environment on skeletal development. Different global (i.e., organ-level) mechanical loads applied to bone fractures or osteotomies are known to result in different healing outcomes. However, the local stimuli that promote formation of different skeletal tissues have yet to be established. Finite element analyses can estimate local stresses and strains but require many assumptions regarding tissue material properties and boundary conditions. This study used an experimental approach to investigate relationships between the strains experienced by tissues in a mechanically stimulated osteotomy gap and the patterns of tissue differentiation that occur during healing. Strains induced by the applied, global mechanical loads were quantified on the mid-sagittal plane of the callus using digital image correlation. Strain fields were then compared to the distribution of tissue phenotypes, as quantified by histomorphometry, using logistic regression. Significant and consistent associations were found between the strains experienced by a region of the callus and the tissue type present in that region. Specifically, the probability of encountering cartilage increased, and that of encountering woven bone decreased, with increasing octahedral shear strain and, to a lesser extent, maximum principal strain. Volumetric strain was the least consistent predictor of tissue type, although towards the end of the four-week stimulation timecourse, cartilage was associated with increasingly negative volumetric strains. These results indicate that shear strain may be an important regulator of tissue fate during skeletal healing.


Figures

Figure 1
Figure 1
In preparation for the strain measurements, (A) the lateral half of the portion of the callus located between the two inner pins was removed using a circular blade attached to a dental hand motor, and (B) the newly exposed, mid-sagittal plane was specked with black enamel paint using an airbrush.
Figure 2
Figure 2
(A) The first image of each image pair that is analyzed using the SMLE digital image correlation method is discretized into finite elements in such a way that the mesh conforms to the regions of interest. The mesh geometry was generated from the digital images using Matlab (Mathworks, Natick, MA) and Truegrid (XYZ Scientific Applications, Inc., Livermore, CA). This process involved defining the boundaries of the region of interest (the portion of the exposed mid-sagittal plane that was located between the two inner pins) and then projecting a rectangular mesh onto these boundaries. (B) The corresponding deformed mesh at a bending angle of 35°; the displacement of each node from its original position in panel A was determined using the SMLE digital image correlation technique. (C) Nodal displacements, displayed as vectors, in the region of interest
Figure 3
Figure 3
For each histological section, a grid of points was defined in the (A) anterior, (B) central, and (C) posterior regions of the portion of the callus located between the two inner pins. The anterior and posterior boundaries of each region were defined by the periosteal surface of the cortex and by the anterior and posterior boundaries of the callus. A fixed number of grid points (N1, N2, and N3 for the anterior, central and posterior regions, respectively) was used for each region. For POD 17 sections, N1=55×15, N2=55×30, and N3=55×15. For POD 24 and 38 sections, N1=55×30, N2=55×35, and N3=55×35. These were the minimum numbers of points that reproduced the trends in tissue areas measured previously via histomorphometry (Salisbury Palomares, et al., 2009). For each region in each histological section, each rectangular grid of points was made to conform to the shape of the region via projection of the grid onto the boundaries of the region (TrueGrid, XYZ Scientific, Livermore, CA). During the segmentation process that was carried out in the previous histomorphometric analyses, the digital images of the histological sections were converted to grayscale with each tissue type represented by a single grayvalue. No fibrocartilage was present in this section. The tissue type “Other” included any tissue other than cartilage, fibrocartilage, cortical bone, and woven bone as well as void space. (D) The strain fields computed from the SMLE technique were sampled at corresponding points. Correspondence was determined by using the digital camera images (Figure 1B) to identify the locations of the periosteal surface of the cortex; these locations allowed subdivision of the strain fields into anterior, central, and posterior regions (boundaries shown with black lines). The locations of the grid points were defined using the same boundary projection method that was used for the histological sections.
Figure 4
Figure 4
Representative strain fields for the regions of interest in specimens at POD 10, 24, and 38 at a bending angle of 35°. The strains are shown only on the region of interest, which is depicted for a representative specimen via the dashed line superimposed on the top left digital image. The strains are plotted using the original (0°) coordinates; however, in order to illustrate the direction of the applied bending motion, the corresponding digital image at 35° is shown at the top right. During the bending motion, the right (proximal) side of the region of interest stays approximately fixed, while the left (distal) side is displaced upwards and to the right. Emax is the maximum principal strain, Evol the volumetric strain, and Eoct the octahedral shear strain. Strains are displayed in units of mm/mm.
Figure 5
Figure 5
(A) The distribution of each tissue type within a representative histological section at post-operative day 24 with respect to the average distribution of octahedral shear strain measured at post-operative day 24: The distribution is expressed in terms of relative frequency, defined for each tissue type as the number of grid points experiencing a given value of shear strain and occupied by that tissue type normalized by the total number of grid points occupied by that tissue type. Tissue type is abbreviated as “CA” for cartilage, “WB” for newly formed woven bone, and “CB” for cortical bone (the cortex). No fibrocartilage was found in this section. (B) Results from the logistic regression analysis performed on this histological section: Each tissue type is represented by a color, and the height of the colored area at a given value of octahedral shear strain corresponds to the probability of encountering that tissue type at that value of shear strain. For this section, the probability of encountering cartilage increased, and the probabilities of encountering woven bone and cortical bone decreased, with increasing shear strain (p<0.05).
Figure 5
Figure 5
(A) The distribution of each tissue type within a representative histological section at post-operative day 24 with respect to the average distribution of octahedral shear strain measured at post-operative day 24: The distribution is expressed in terms of relative frequency, defined for each tissue type as the number of grid points experiencing a given value of shear strain and occupied by that tissue type normalized by the total number of grid points occupied by that tissue type. Tissue type is abbreviated as “CA” for cartilage, “WB” for newly formed woven bone, and “CB” for cortical bone (the cortex). No fibrocartilage was found in this section. (B) Results from the logistic regression analysis performed on this histological section: Each tissue type is represented by a color, and the height of the colored area at a given value of octahedral shear strain corresponds to the probability of encountering that tissue type at that value of shear strain. For this section, the probability of encountering cartilage increased, and the probabilities of encountering woven bone and cortical bone decreased, with increasing shear strain (p<0.05).
Figure 6
Figure 6
Fraction of the number of histological sections for which the probability of encountering a given type of tissue increased with (p<0.05), decreased with (p<0.05), or did not change (p>0.05) with increasing (A) octahedral shear strain (Eoct), (B) maximum principal strain (Emax), and (C) volumetric strain (Evol). In the pairs of numbers at the bottom of each plot, the first number is the post-operative day at which the strains were measured, and the second number is the post-operative day at which the histological analysis was conducted. Tissue type is abbreviated as “CA” for cartilage, “WB” for woven bone, “CB” for cortical bone (the cortex), and “FC” for fibrocartilage. In all cases the fraction of the number of sections is reported as the fraction of the number of sections in which the tissue type was found. Fibrocartilage was found in only 30-75% of the sections, depending on the timpoint, and the other tissue types were found in all sections.
Figure 6
Figure 6
Fraction of the number of histological sections for which the probability of encountering a given type of tissue increased with (p<0.05), decreased with (p<0.05), or did not change (p>0.05) with increasing (A) octahedral shear strain (Eoct), (B) maximum principal strain (Emax), and (C) volumetric strain (Evol). In the pairs of numbers at the bottom of each plot, the first number is the post-operative day at which the strains were measured, and the second number is the post-operative day at which the histological analysis was conducted. Tissue type is abbreviated as “CA” for cartilage, “WB” for woven bone, “CB” for cortical bone (the cortex), and “FC” for fibrocartilage. In all cases the fraction of the number of sections is reported as the fraction of the number of sections in which the tissue type was found. Fibrocartilage was found in only 30-75% of the sections, depending on the timpoint, and the other tissue types were found in all sections.

References

    1. Bottlang M, Mohr M, Simon U, Claes L. Acquisition of full-field strain distributions on ovine fracture callus cross-sections with electronic speckle pattern interferometry. J Biomech. 2008;41:701–5. - PubMed
    1. Carter DR, Beaupre GS, Giori NJ, Helms JA. Mechanobiology of skeletal regeneration. Clin Orthop. 1998:S41–55. - PubMed
    1. Claes LE, Heigele CA. Magnitudes of local stress and strain along bony surfaces predict the course and type of fracture healing. J Biomech. 1999;32:255–66. - PubMed
    1. Claes LE, Wilke HJ, Augat P, Rubenacker S, Margevicius KJ. Effect of dynamization on gap healing of diaphyseal fractures under external fixation. Clin Biomech (Bristol, Avon) 1995;10:227–34. - PubMed
    1. Cullinane DM, Fredrick A, Eisenberg SR, Pacicca D, Elman MV, Lee C, Salisbury K, Gerstenfeld LC, Einhorn TA. Induction of a neoarthrosis by precisely controlled motion in an experimental mid-femoral defect. J Orthop Res. 2002;20:579–86. - PubMed

Publication types