

Skeletal muscle catabolism in trinitrobenzene sulfonic acid-induced murine colitis
- PMID: 20546811
- PMCID: PMC2941564
- DOI: 10.1016/j.metabol.2010.03.021
Skeletal muscle catabolism in trinitrobenzene sulfonic acid-induced murine colitis
Abstract
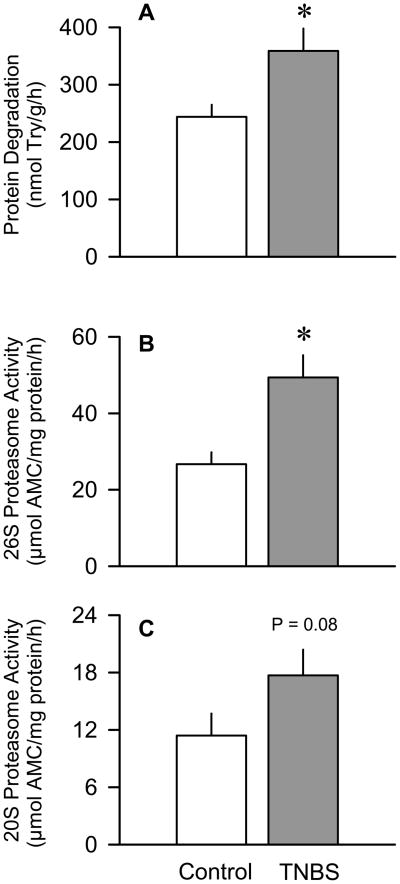
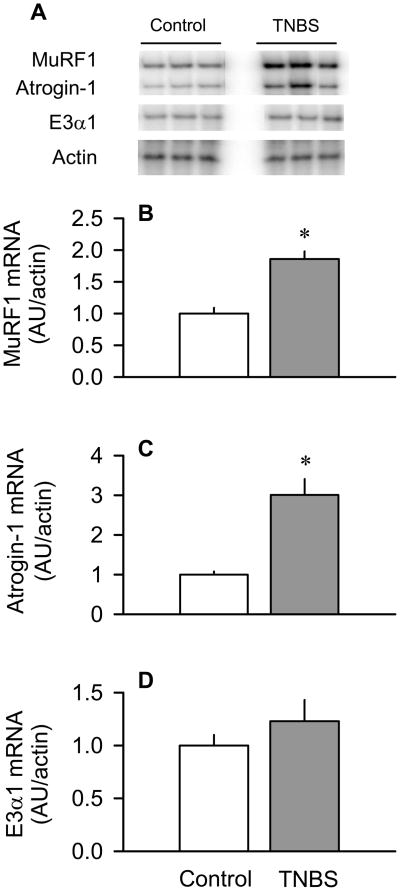
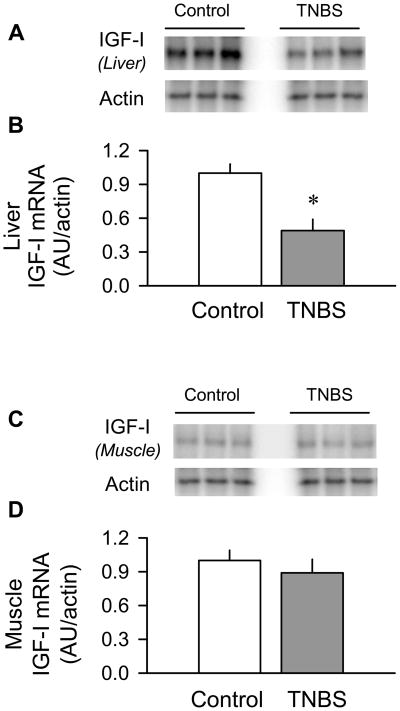
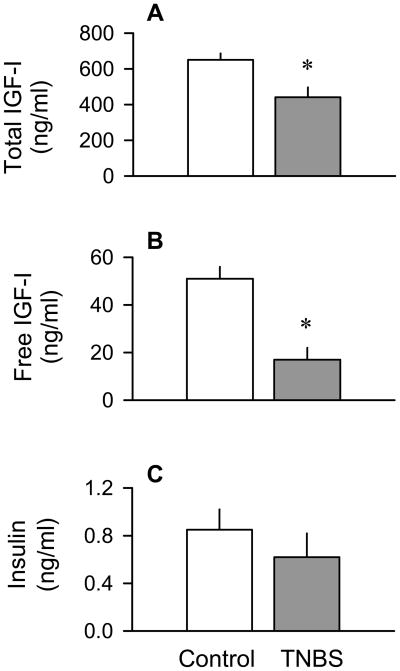
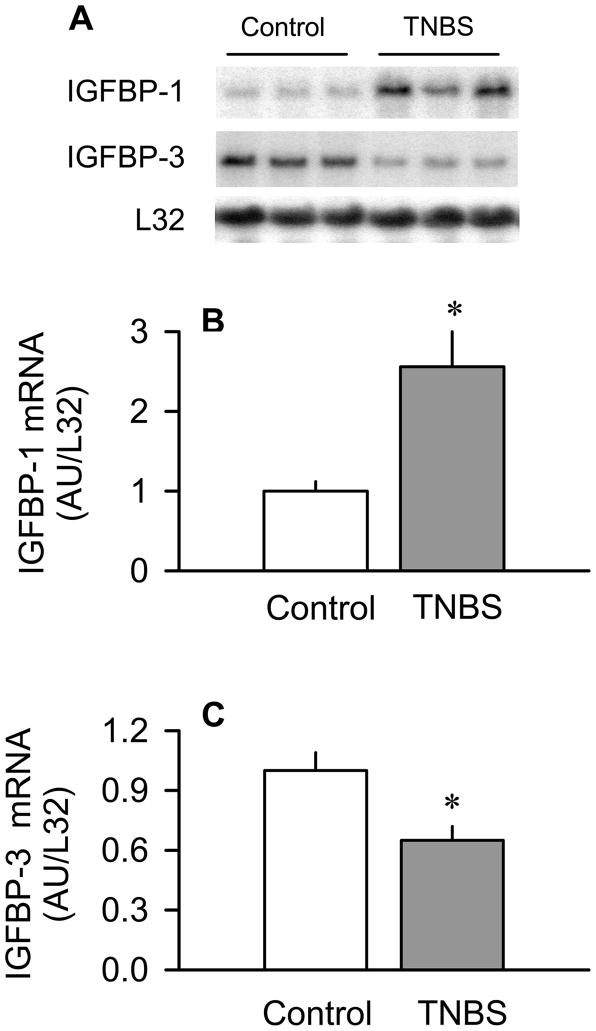
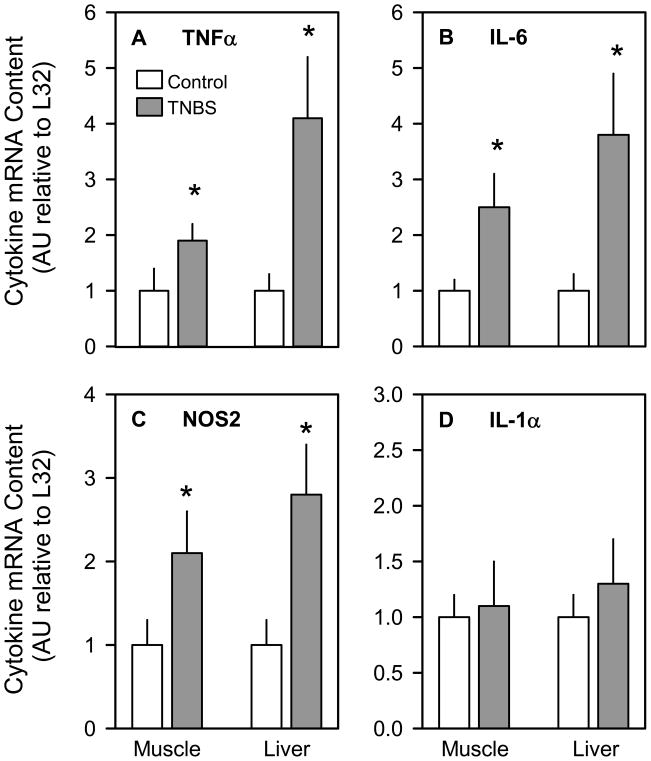
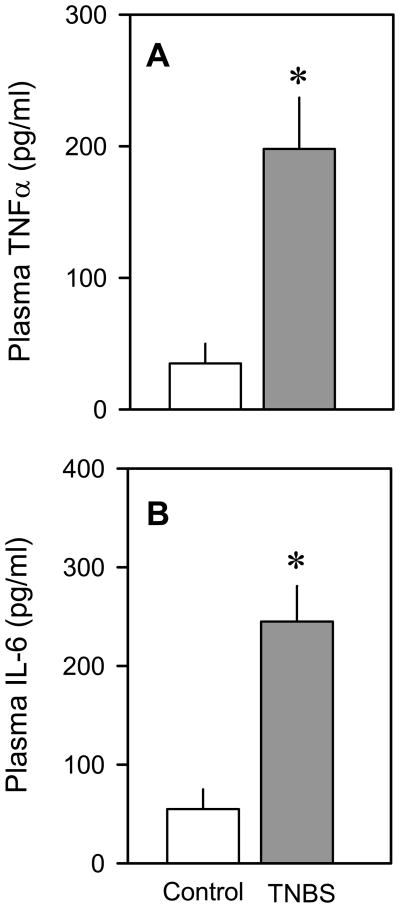
The present study determined whether the muscle atrophy produced by colitis is associated with altered rates of muscle protein synthesis or degradation, as well as the potential role of the local (eg, muscle) insulin-like growth factor (IGF) system and muscle-specific ubiquitin E3 ligases atrogin-1 and MuRF1 in mediating altered muscle protein balance. Colitis was induced in C57BL/6 mice by intrarectal administration of trinitrobenzene sulfonic acid (TNBS), and blood and tissues were collected on day 10. Mice with inflammatory bowel disease demonstrated reduced skeletal muscle mass and protein content, whereas colonic segment weight and gross damage score were both increased in mice with colitis, compared with time-matched control values. There was no change in muscle protein synthesis in mice with inflammatory bowel disease; but there was an increased protein breakdown (45%), proteasome activity (85%), and messenger RNA (mRNA) expression for atrogin-1 and MuRF1 (200%-300%) in muscle. These changes were associated with a reduction in liver (but not muscle) IGF-I mRNA as well as a reduction in both total and free IGF-I in the blood. Colitis decreased the hepatic content of IGF binding protein (IGFBP)-3 mRNA by 40% and increased IGFBP-1 mRNA by 100%. In contrast, colitis did alter IGFBP mRNAs in muscle. The tumor necrosis factor-α, interleukin-6, and nitric oxide synthase 2 mRNA content of both liver and skeletal muscle was increased in TNBS-treated mice; and plasma tumor necrosis factor-α and interleukin-6 concentrations were also elevated. These data suggest that TNBS-induced colitis is independent of a change in muscle protein synthesis but dependent on stimulation of protein degradation via increased expression of muscle-specific atrogenes, which may be mediated in part by the reduction in circulating concentration of IGF-I and the concomitant increase in inflammatory mediators observed in the blood and muscle per se.
Copyright © 2010 Elsevier Inc. All rights reserved.
Conflict of interest statement
Figures
Similar articles
-
IGF-I stimulates muscle growth by suppressing protein breakdown and expression of atrophy-related ubiquitin ligases, atrogin-1 and MuRF1.Am J Physiol Endocrinol Metab. 2004 Oct;287(4):E591-601. doi: 10.1152/ajpendo.00073.2004. Epub 2004 Apr 20. Am J Physiol Endocrinol Metab. 2004. PMID: 15100091
-
Amelioration of excess collagen IαI, fibrosis, and smooth muscle growth in TNBS-induced colitis in IGF-I(+/-) mice.Inflamm Bowel Dis. 2011 Mar;17(3):711-9. doi: 10.1002/ibd.21437. Epub 2010 Aug 18. Inflamm Bowel Dis. 2011. PMID: 20722057 Free PMC article.
-
Systemic IGF-I administration attenuates the inhibitory effect of chronic arthritis on gastrocnemius mass and decreases atrogin-1 and IGFBP-3.Am J Physiol Regul Integr Comp Physiol. 2010 Aug;299(2):R541-51. doi: 10.1152/ajpregu.00211.2010. Epub 2010 Jun 2. Am J Physiol Regul Integr Comp Physiol. 2010. PMID: 20519361
-
Molecular signaling pathways regulating muscle proteolysis during atrophy.Curr Opin Clin Nutr Metab Care. 2005 May;8(3):271-5. doi: 10.1097/01.mco.0000165005.01331.45. Curr Opin Clin Nutr Metab Care. 2005. PMID: 15809529 Review.
-
Molecular mechanisms modulating muscle mass.Trends Mol Med. 2003 Aug;9(8):344-50. doi: 10.1016/s1471-4914(03)00138-2. Trends Mol Med. 2003. PMID: 12928036 Review.
Cited by
-
Inflammatory Bowel Diseases and Sarcopenia: The Role of Inflammation and Gut Microbiota in the Development of Muscle Failure.Front Immunol. 2021 Jul 13;12:694217. doi: 10.3389/fimmu.2021.694217. eCollection 2021. Front Immunol. 2021. PMID: 34326845 Free PMC article. Review.
-
Inflammaging: Implications in Sarcopenia.Int J Mol Sci. 2022 Nov 30;23(23):15039. doi: 10.3390/ijms232315039. Int J Mol Sci. 2022. PMID: 36499366 Free PMC article. Review.
-
Role of IGFBP-3 in Human Diseases Relying on Different Cell Signaling Pathways.Adv Biomed Res. 2025 Feb 28;14:15. doi: 10.4103/abr.abr_23_23. eCollection 2025. Adv Biomed Res. 2025. PMID: 40213590 Free PMC article. Review.
-
Effect of Forced Physical Activity on the Severity of Experimental Colitis in Normal Weight and Obese Mice. Involvement of Oxidative Stress and Proinflammatory Biomarkers.Nutrients. 2019 May 21;11(5):1127. doi: 10.3390/nu11051127. Nutrients. 2019. PMID: 31117199 Free PMC article.
-
Progress of linking gut microbiota and musculoskeletal health: casualty, mechanisms, and translational values.Gut Microbes. 2023 Dec;15(2):2263207. doi: 10.1080/19490976.2023.2263207. Epub 2023 Oct 6. Gut Microbes. 2023. PMID: 37800576 Free PMC article. Review.
References
-
- Motil KJ, Grand RJ, vis-Kraft L, et al. Growth failure in children with inflammatory bowel disease: a prospective study. Gastroenterology. 1993;105:681–691. - PubMed
-
- Ballinger A. Fundamental mechanisms of growth failure in inflammatory bowel disease. Horm Res. 2002;58 (Suppl 1):7–10. - PubMed
-
- Shamir R, Phillip M, Levine A. Growth retardation in pediatric Crohn’s disease: pathogenesis and interventions. Inflamm Bowel Dis. 2007;13:620–628. - PubMed
Publication types
MeSH terms
Substances
Grants and funding
LinkOut - more resources
Full Text Sources
Miscellaneous
