Comparative Study
. 2010 Jun 10;66(5):796-807.
doi: 10.1016/j.neuron.2010.05.005.

Representation of multiple, independent categories in the primate prefrontal cortex

Affiliations
Comparative Study

Representation of multiple, independent categories in the primate prefrontal cortex

Jason A Cromer et al. Neuron. .

Abstract

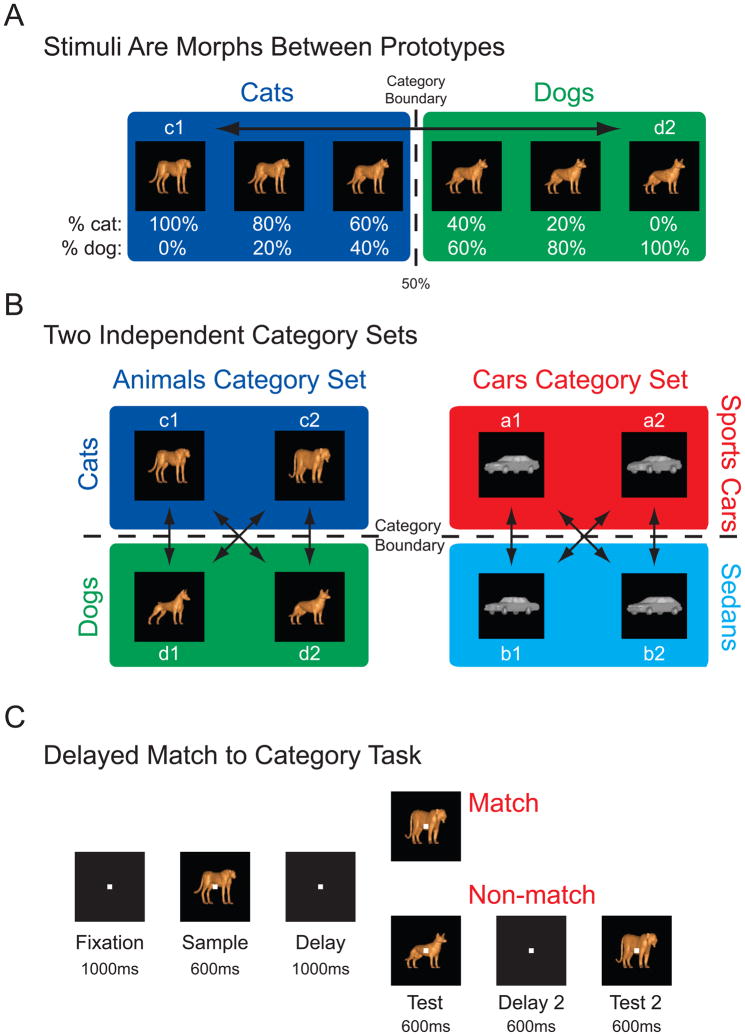
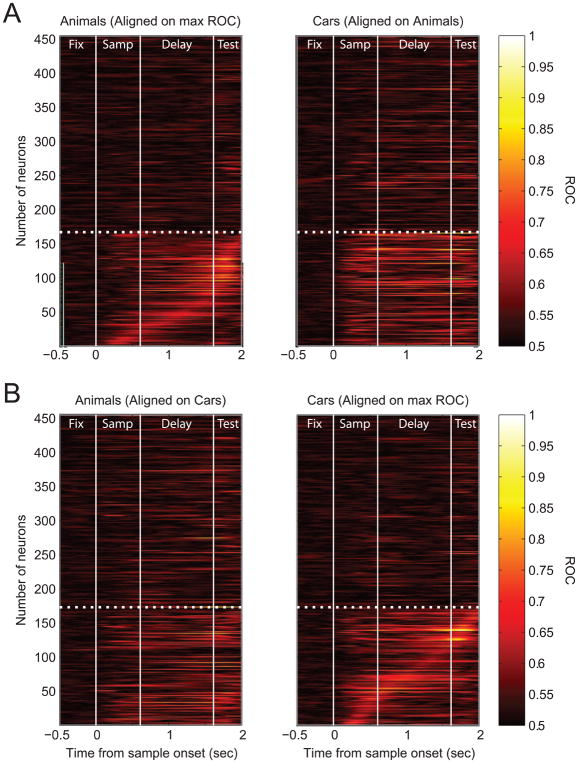
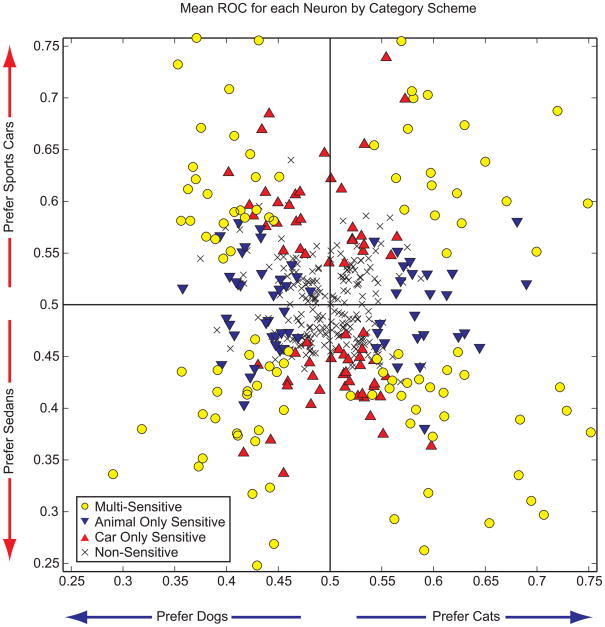
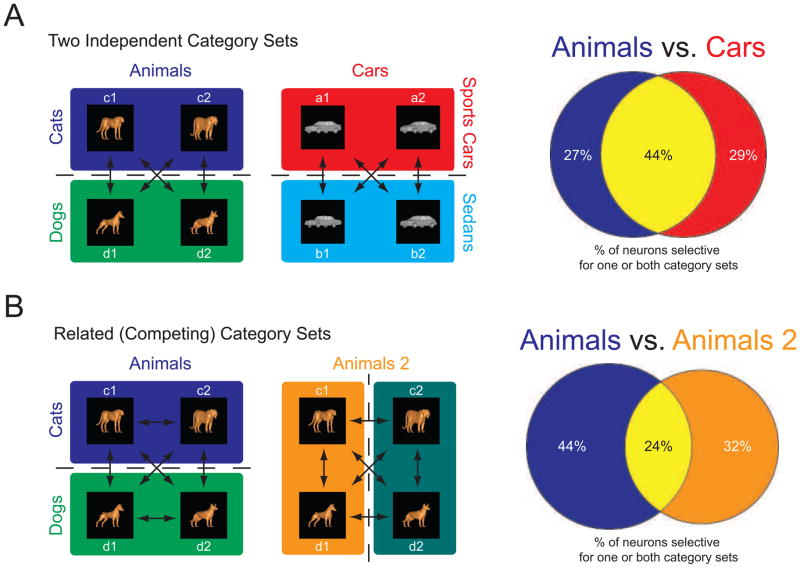
Neural correlates of visual categories have been previously identified in the prefrontal cortex (PFC). However, whether individual neurons can represent multiple categories is unknown. Varying degrees of generalization versus specialization of neurons in the PFC have been theorized. We recorded from lateral PFC neural activity while monkeys switched between two different and independent categorical distinctions (Cats versus Dogs, Sports Cars versus Sedans). We found that many PFC neurons reflected both categorical distinctions. In fact, these multitasking neurons had the strongest category effects. This stands in contrast to our lab's recent report that monkeys switching between competing categorical distinctions (applied to the same stimulus set) showed independent representations. We suggest that cognitive demands determine whether PFC neurons function as category "multitaskers."


Figures

Figure 1
Figure 1. Stimulus Set & Behavioral Task
A: Morphing allowed parameterization of sample images. An example morph line between Cat prototype c1 and Dog prototype d2 displays images at the morph steps used for recording. Intermediate images were a mix of the two prototypes. Those images comprised of greater than 50% of one category (marked by the ‘Category Boundary’) where to be classified as a member of that category. B: Stimuli came from two independent category sets, Animals and Cars. The Animal category set was divided into “Cats” vs. “Dogs” and the Car category set had “Sports Cars” and “Sedans” categories. Both sets were comprised of four prototype images (two from each category as shown) as well as images along four between category morph lines. C: The delayed match to category task required monkeys to respond to whether a test stimulus matched the category of the sample stimulus. During the sample and delay periods, the monkeys must hold in memory the category of the sample stimulus but the outcome of the trial is unknown.
Figure 2
Figure 2. Behavior & Single Neuron Example
A & B: Performance of both monkeys on the delayed match to category task with multiple, independent category distinctions across all recording sessions. Monkeys were able to categorize both Animals and Cars exceptionally well, and displayed a hallmark step function in behavior at the category boundary. Error bars represent standard error of the mean. C: A single PFC neurons showed distinct firing for stimuli of one category (e.g., Sedans) vs. the other category (e.g., Sports Cars). Note how all morph percentages on either side of the category boundary (50%) grouped together (e.g., blue vs. red lines), despite the fact that sample images near the boundary line (60%/40%, dark lines) were closer in physical similarity. Thus, this neuron responded to the category membership of the stimuli rather than their visual properties. This individual PFC neuron multitasked, categorizing both Animals (Cats vs. Dogs) and Cars (Sedans vs. Sports Cars) during the late delay interval.
Figure 3
Figure 3. Category Selectivity by Morph Level
Normalized neuronal firing of category sensitive neurons sorted by the percentage of each neuron’s preferred category that made up the sample image. During fixation (baseline) no category effect is present, but during the sample, delay, and test periods there is a significant difference in firing across the category boundary (but not within). The same hallmark step function as seen in the monkeys’ behavior is seen in the neural population activity. Error bars indicate standard error of the mean. Asterisks indicate that bars were significantly different (t-tests, p < 0.05) from each bar on the opposite side of the category boundary. Bars on the same side of category boundary were never significantly different.
Figure 4
Figure 4. Category Selectivity Across All Images
Correlations values (r) were computed for all neurons’ mean responses to all possible pairings of sample images from the same category set (images 1–20, either Animals or Cars). Figure Key: Correlation values were then used to define the color of each square in a matrix representing these image pairings. The matrix was arranged such that images 1–10 came from one category (e.g., “Sports Cars”) and images 11–20 came from the opposite category (e.g., “Sedans”). The matrix was further subdivided such that every five images came from the same prototype. A: The average activity of PFC Animal sensitive neurons to images from the same category was highly correlated (similar) - as seen in the warm-colored squares, whereas correlations to images from different categories was negative - deep blue squares. This was true for both the Animal category distinction (left panel) as well as for the Car category distinction (right panel), despite the fact that Car sensitivity was not a factor in selecting the neurons. Thus, Animal sensitive neurons multitask and also convey information about the Car category. B: Car sensitive neurons display strong selectivity to the Car category distinction as well as sensitivity to the Animal category distinction. Again, activity is strongest for the expected distinction (Cars), but clearly evident for the non-selected distinction (Animals) due to multitasking neurons. C: Non-category sensitive neurons had low correlation between the sample images and these correlations were non-significant across categories (between images 1–10 and 11–20). P values indicate significance between categories as determined by permutation tests (see text).
Figure 5
Figure 5. ROCs for the Recorded PFC Population
A: ROC values for each of the recorded 455 PFC neurons are shown, with the same neuron depicted in the same row on the left and right panels. Bright orange colors indicate high category sensitivity. Neurons identified previously as sensitive to the Cats vs. Dogs category distinction (via t-test) are sorted on max ROC (left panel, below the dashed white line). The same neurons have the highest ROC values for the Sports Cars vs. Sedans category distinction (right panel). B: Data as in panel A now realigned on the max ROC for Car sensitive neurons. Again, the majority of selectivity for both category distinctions is in the lower portion of the panels below the dashed white line, even though the Animal ROCs are aligned to match the Car sensitivity. Thus, the majority of PFC category sensitive neurons multi-task and encode both category distinctions.
Figure 6
Figure 6. Mean ROCs for each Category Scheme
Mean ROC values for all recorded neurons to both category distinctions. Data points are color coded based on significant category sensitivity via t-test. Values closer to the origin indicate weaker category sensitivity for the given distinction. Data points were equally distributed in all four quadrants, indicating equal neuronal preference for all categories. Data points furthest from the origin in all four directions were from those multitasking neurons sensitive to both the Animal and Car category schemes (yellow circles).
Figure 7
Figure 7. Multitasking of Neurons for Independent and Competing Category Schemes
A: In the current study, when monkeys categorized two independent category sets (Animals and Cars), 44% of category sensitive neurons showed category effects for both category sets. B: This is in contrast to another study from our laboratory (Roy et al., 2010) in which the same images were categorized under two different (orthogonal) category sets: Animals (“Cats vs. Dogs”) or Animals2 (a new category distinction based on two unique combinations of a cat and dog prototype). The Cat and Dog categories were the same used in this study. In the Roy et al. (2010) experiment with orthogonal category sets, fewer PFC neurons (24%) showed category sensitivity for both category distinctions.

Similar articles

Cited by

References

    1. Aron AR, Gluck MA, Poldrack RA. Long-term test-retest reliability of functional MRI in a classification learning task. Neuroimage. 2006;29:1000–1006. - PMC - PubMed
    1. Beymer D, Poggio T. Image representations for visual learning. Science. 1996;272:1905–1909. - PubMed
    1. Bolte S, Holtmann M, Poustka F, Scheurich A, Schmidt L. Gestalt perception and local-global processing in high-functioning autism. J Autism Dev Disord. 2007;37:1493–1504. - PubMed
    1. Bonelli RM, Cummings JL. Frontal-subcortical circuitry and behavior. Dialogues Clin Neurosci. 2007;9:141–151. - PMC - PubMed
    1. Buschman TJ, Miller EK. Rules through recursion: How interactions between the frontal cortex and basal ganglia may build abstract, complex, rules from concrete, simple, ones. In: Bunge SA, Wallis JD, editors. Neuroscience of rule-guided behavior. Oxford; New York: Oxford University Press; 2008.

Publication types