Regulating the availability of transforming growth factor ß1 in B104 neuroblastoma cells
- PMID: 20547156
- PMCID: PMC2922400
- DOI: 10.1016/j.expneurol.2010.06.002
Regulating the availability of transforming growth factor ß1 in B104 neuroblastoma cells
Erratum in
- Exp Neurol. 2011 Jan;227(1):236
Abstract
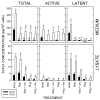
Transforming growth factor (TGF) beta1 is a key player in early brain development, hence, its availability (i.e., synthesis and release) affects neuronogenesis. TGFbeta1 moves proliferating cells out of the cell cycle and promotes their subsequent migration. The present study tested the hypothesis that neural progenitors self-regulate TGFbeta1. B104 neuroblastoma cells which can grow in the absence of serum or growth factors were used in systematic studies of transcription, translation, release, and activation. These studies relied on quantitative enzyme-linked immunosorbent assays and real-time polymerase chain reactions. TGFbeta1 positively upregulated its own intracellular expression and promoted increased release of TGFbeta1 from cells. The induction of TGFbeta1 was independent of a change in transcription, but it depended on cycloheximide-inhibited translation. Signaling mediated by downstream Smad2/3 through the TGFbeta receptors and intracellular protein transport were also required for release of TGFbeta1 from B104 cells. Thus, TGFbeta1 production and release were mediated through a feed-forward mechanism and were pivotally regulated at the level of translation. These activities appear to be key for the role of TGFbeta1 in the proliferation and migration of young neurons.
Published by Elsevier Inc.
Figures


Similar articles
-
Transforming growth factor beta1 and ethanol affect transcription and translation of genes and proteins for cell adhesion molecules in B104 neuroblastoma cells.J Neurochem. 2006 May;97(4):1182-90. doi: 10.1111/j.1471-4159.2006.03858.x. J Neurochem. 2006. PMID: 16686695
-
Transforming growth factor beta1-regulated cell proliferation and expression of neural cell adhesion molecule in B104 neuroblastoma cells: differential effects of ethanol.J Neurochem. 1999 Jun;72(6):2286-93. doi: 10.1046/j.1471-4159.1999.0722286.x. J Neurochem. 1999. PMID: 10349837
-
The mechanism of epithelial-mesenchymal transition induced by TGF-β1 in neuroblastoma cells.Int J Oncol. 2017 May;50(5):1623-1633. doi: 10.3892/ijo.2017.3954. Epub 2017 Apr 5. Int J Oncol. 2017. PMID: 28393230 Free PMC article.
-
TGFβR1 Blockade with Galunisertib (LY2157299) Enhances Anti-Neuroblastoma Activity of the Anti-GD2 Antibody Dinutuximab (ch14.18) with Natural Killer Cells.Clin Cancer Res. 2017 Feb 1;23(3):804-813. doi: 10.1158/1078-0432.CCR-16-1743. Epub 2016 Oct 10. Clin Cancer Res. 2017. PMID: 27756784 Free PMC article.
-
Role and clinical significance of TGF‑β1 and TGF‑βR1 in malignant tumors (Review).Int J Mol Med. 2021 Apr;47(4):55. doi: 10.3892/ijmm.2021.4888. Epub 2021 Feb 19. Int J Mol Med. 2021. PMID: 33604683 Free PMC article. Review.
References
-
- Abel EL. Prenatal effects of alcohol. Drug Alcohol Depend. 1984;14:1–10. - PubMed
-
- Allison RS, Mumy ML, Wakefield LM. Translational control elements in the major human transforming growth factor β1 mRNA. Growth Factors. 1998;16:89–100. - PubMed
-
- Asakura K, Hunter SF, Rodriguez M. Effects of transforming growth factor β and platelet-derived growth factor on oligodendrocyte precursors: insights gained from a neuronal cell line. J Neurochem. 1997;68:2281–2290. - PubMed
Publication types
MeSH terms
Substances
Grants and funding
LinkOut - more resources
Full Text Sources
Other Literature Sources
Medical

