

Regulation of p53 tumor suppressor by Helicobacter pylori in gastric epithelial cells
- PMID: 20547161
- PMCID: PMC2949494
- DOI: 10.1053/j.gastro.2010.06.018
Regulation of p53 tumor suppressor by Helicobacter pylori in gastric epithelial cells
Abstract
Background & aims: Infection with the gastric mucosal pathogen Helicobacter pylori is the strongest identified risk factor for distal gastric cancer. These bacteria colonize a significant part of the world's population. We investigated the molecular mechanisms of p53 regulation in H pylori-infected cells.
Methods: Mongolian gerbils were challenged with H pylori and their gastric tissues were analyzed by immunohistochemistry and immunoblotting with p53 antibodies. Gastric epithelial cells were co-cultured with H pylori and the regulation of p53 was assessed by real-time polymerase chain reaction, immunoblotting, immunofluorescence, and cell survival assays. Short hairpin RNA and dominant-negative mutants were used to inhibit activities of Human Double Minute 2 (HDM2) and AKT1 proteins.
Results: We found that in addition to previously reported up-regulation of p53, H pylori can also negatively regulate p53 by increasing ubiquitination and proteasomal degradation via activation of the serine/threonine kinase AKT1, which phosphorylates and activates the ubiquitin ligase HDM2. These effects were mediated by the bacterial virulence factor CagA; ectopic expression of CagA in gastric epithelial cells increased phosphorylation of HDM2 along with the ubiquitination and proteasomal degradation of p53. The decrease in p53 levels increased survival of gastric epithelial cells that had sustained DNA damage.
Conclusions: H pylori is able to inhibit the tumor suppressor p53. H pylori activates AKT1, resulting in phosphorylation and activation of HDM2 and subsequent degradation of p53 in gastric epithelial cells. H pylori-induced dysregulation of p53 is a potential mechanism by which the microorganism increases the risk of gastric cancer in infected individuals.
Copyright © 2010 AGA Institute. Published by Elsevier Inc. All rights reserved.
Conflict of interest statement
The authors have no conflict of interest to disclose.
Figures
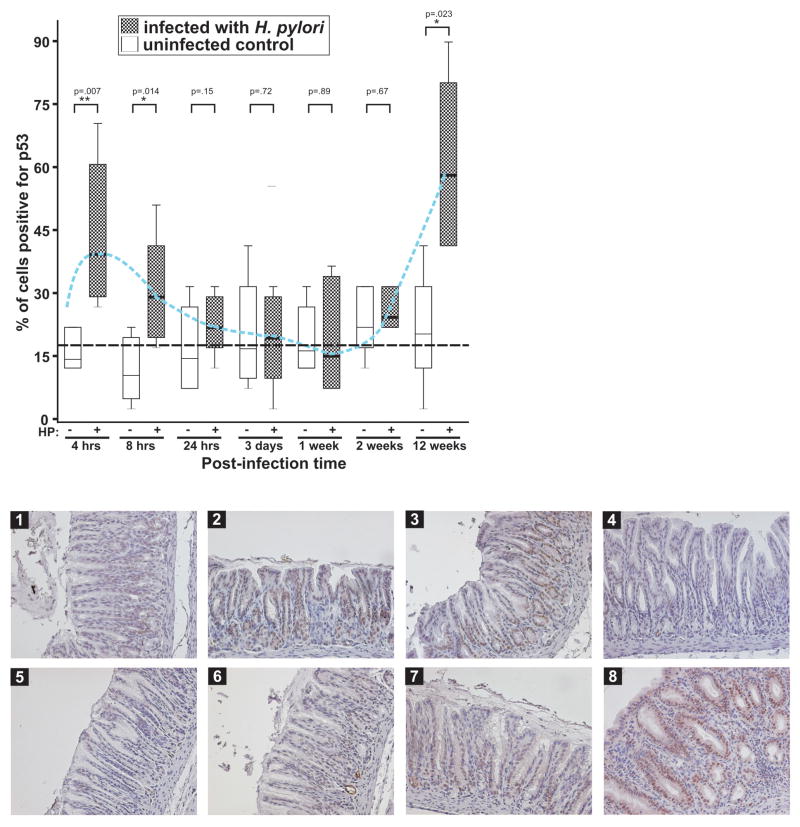
 ) for infected and uninfected animals are shown. The blue dashed line connects mean values for p53 expression in infected gerbils. The black dashed line depicts the average levels of p53 in the uninfected control. Lower panel: representative staining for p53 (x20) is shown for uninfected control (1) and infected animals for 4 hrs(2), 8 hrs(3), 24 hrs(4), 3 days(5), 1 week(6), 2 weeks(7), and 12 weeks(8).


 ) for cagA− and cagA+ infected animals are shown. A dashed line depicts the average levels of p53 in the uninfected control animals. Right panel: representative immunohistochemical staining for p53 (x20) is shown for uninfected animals (1) and those infected with wild-type (2) or cagA− (3) isogenic H. pylori strains for 6 hours (at the peak of p53 increase). Levels of p53 were also analyzed by Western blotting with p53-specific antibody at 6 hours. (C) Analysis of HDM2 phosphorylation in AGS cells co-cultured with H. pylori strain J166 or its isogenic cagA− or cagE− derivatives. (D) Analysis of p53 ubiquitination in AGS cells co-cultured with the indicated isogenic H. pylori strains for 24 hours. Proteasomal degradation was inhibited with MG-132.

References
-
- Zhu Y, Zhong X, Zheng S, et al. Transformed immortalized gastric epithelial cells by virulence factor CagA of Helicobacter pylori through Erk mitogen-activated protein kinase pathway. Oncogene. 2005;24:3886–95. - PubMed
-
- Shibata A, Parsonnet J, Longacre TA, et al. CagA status of Helicobacter pylori infection and p53 gene mutations in gastric adenocarcinoma. Carcinogenesis. 2002;23:419–24. - PubMed
-
- Levine AJ. The common mechanisms of transformation by the small DNA tumor viruses: The inactivation of tumor suppressor gene products: p53. Virology. 2009;384:285–93. - PubMed
Publication types
MeSH terms
Substances
Grants and funding
LinkOut - more resources
Full Text Sources
Other Literature Sources
Research Materials
Miscellaneous
