

Circadian oscillators in the epithalamus
- PMID: 20547209
- PMCID: PMC2928449
- DOI: 10.1016/j.neuroscience.2010.06.015
Circadian oscillators in the epithalamus
Abstract
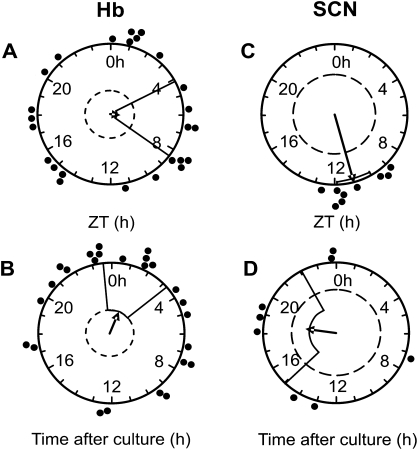
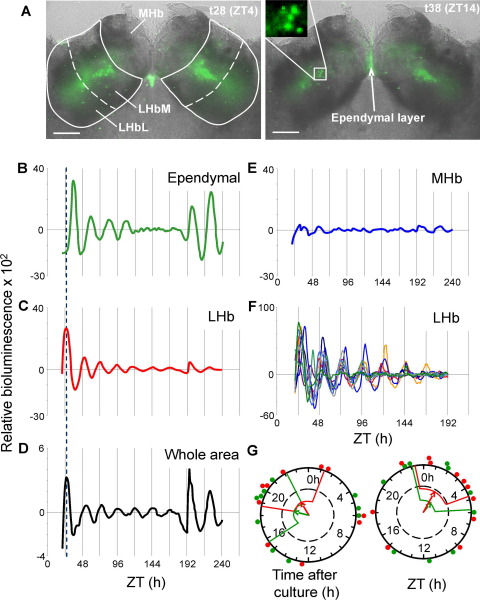
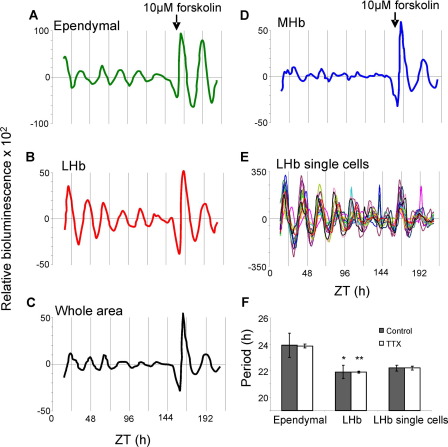
The habenula complex is implicated in a range of cognitive, emotional and reproductive behaviors, and recently this epithalamic structure was suggested to be a component of the brain's circadian system. Circadian timekeeping is driven in cells by the cyclical activity of core clock genes and proteins such as per2/PER2. There are currently no reports of rhythmic clock gene/protein expression in the habenula and therefore the question of whether this structure has an intrinsic molecular clock remains unresolved. Here, using videomicroscopy imaging and photon-counting of a PER2::luciferase (LUC) fusion protein together with multiunit electrophysiological recordings, we tested the endogenous circadian properties of the mouse habenula in vitro. We show that a circadian oscillator is localized primarily to the medial portion of the lateral habenula. Rhythms in PER2:: LUC bioluminescence here are visualized in single cells and oscillations continue in the presence of the sodium channel blocker, tetrodotoxin, indicating that individual cells have intrinsic timekeeping properties. Ependymal cells lining the dorsal third ventricle also express circadian oscillations of PER2. These findings establish that neurons and non-neuronal cells in the epithalamus express rhythms in cellular and molecular activities, indicating a role for circadian oscillators in the temporal regulation of habenula controlled processes and behavior.
(c) 2010 IBRO. Published by Elsevier Ltd. All rights reserved.
Figures

Similar articles
-
A riot of rhythms: neuronal and glial circadian oscillators in the mediobasal hypothalamus.Mol Brain. 2009 Aug 27;2:28. doi: 10.1186/1756-6606-2-28. Mol Brain. 2009. PMID: 19712475 Free PMC article.
-
Daily variation in the electrophysiological activity of mouse medial habenula neurones.J Physiol. 2014 Feb 15;592(4):587-603. doi: 10.1113/jphysiol.2013.263319. Epub 2013 Nov 18. J Physiol. 2014. PMID: 24247982 Free PMC article.
-
Contributions of the lateral habenula to circadian timekeeping.Pharmacol Biochem Behav. 2017 Nov;162:46-54. doi: 10.1016/j.pbb.2017.06.007. Epub 2017 Jun 15. Pharmacol Biochem Behav. 2017. PMID: 28624585 Review.
-
A suprachiasmatic-independent circadian clock(s) in the habenula is affected by Per gene mutations and housing light conditions in mice.Brain Struct Funct. 2019 Jan;224(1):19-31. doi: 10.1007/s00429-018-1756-4. Epub 2018 Sep 21. Brain Struct Funct. 2019. PMID: 30242505
-
Circadian neurons in the lateral habenula: Clocking motivated behaviors.Pharmacol Biochem Behav. 2017 Nov;162:55-61. doi: 10.1016/j.pbb.2017.06.013. Epub 2017 Jun 28. Pharmacol Biochem Behav. 2017. PMID: 28666896 Review.
Cited by
-
Central control of circadian phase in arousal-promoting neurons.PLoS One. 2013 Jun 24;8(6):e67173. doi: 10.1371/journal.pone.0067173. Print 2013. PLoS One. 2013. PMID: 23826226 Free PMC article.
-
Lateral Habenula Beyond Avoidance: Roles in Stress, Memory, and Decision-Making With Implications for Psychiatric Disorders.Front Syst Neurosci. 2022 Mar 3;16:826475. doi: 10.3389/fnsys.2022.826475. eCollection 2022. Front Syst Neurosci. 2022. PMID: 35308564 Free PMC article.
-
Timed daily exercise remodels circadian rhythms in mice.Commun Biol. 2021 Jun 18;4(1):761. doi: 10.1038/s42003-021-02239-2. Commun Biol. 2021. PMID: 34145388 Free PMC article.
-
Keeping time in the lamina terminalis: Novel oscillator properties of forebrain sensory circumventricular organs.FASEB J. 2020 Jan;34(1):974-987. doi: 10.1096/fj.201901111R. Epub 2019 Nov 28. FASEB J. 2020. PMID: 31914667 Free PMC article.
-
The circadian clock in the mouse habenula is set by catecholamines.Cell Tissue Res. 2022 Feb;387(2):261-274. doi: 10.1007/s00441-021-03557-x. Epub 2021 Nov 24. Cell Tissue Res. 2022. PMID: 34816282
References
-
- Albus H., Bonnefont X., Chaves I., Yasui A., Doczy J., van der Horst G.T., Meijer J.H. Cryptochrome-deficient mice lack circadian electrical activity in the suprachiasmatic nuclei. Curr Biol. 2002;12:1130–1133. - PubMed
-
- American Psychiatric Association . 4th edn. American Psychiatric Association; Washington, DC: 2000. Diagnostic and statistical manual of mental disorders.
Publication types
MeSH terms
Grants and funding
LinkOut - more resources
Full Text Sources
