

Phenothiazine neuroleptics signal to the human insulin promoter as revealed by a novel high-throughput screen
- PMID: 20547533
- PMCID: PMC3374493
- DOI: 10.1177/1087057110372257
Phenothiazine neuroleptics signal to the human insulin promoter as revealed by a novel high-throughput screen
Abstract
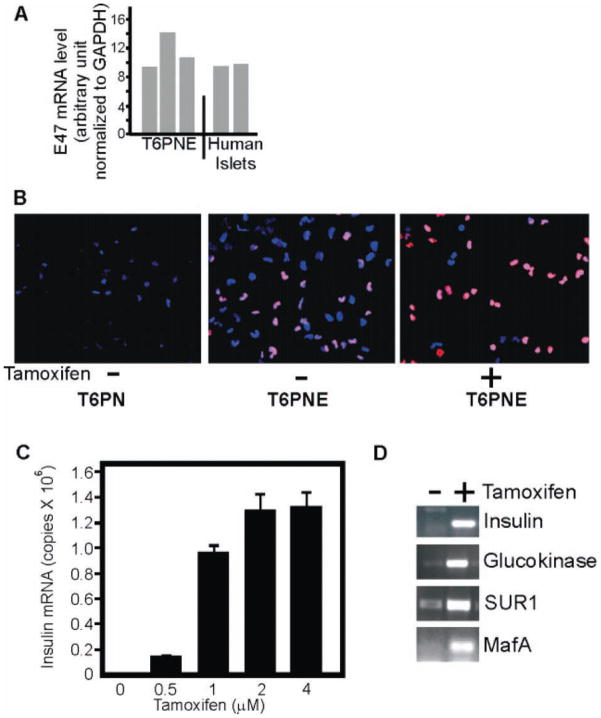
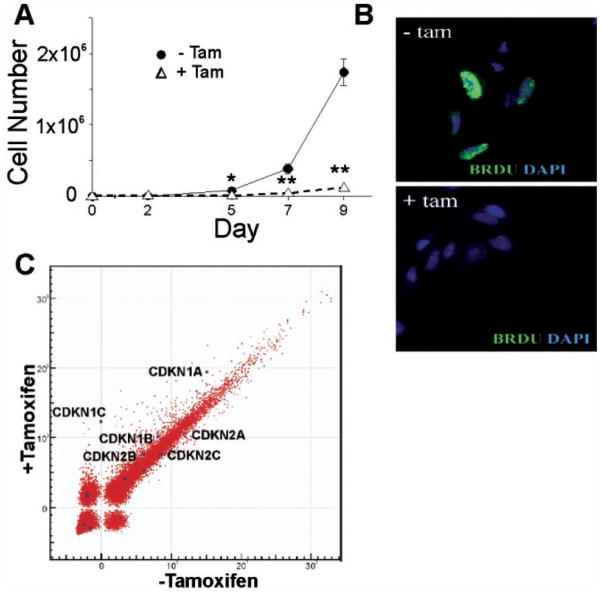
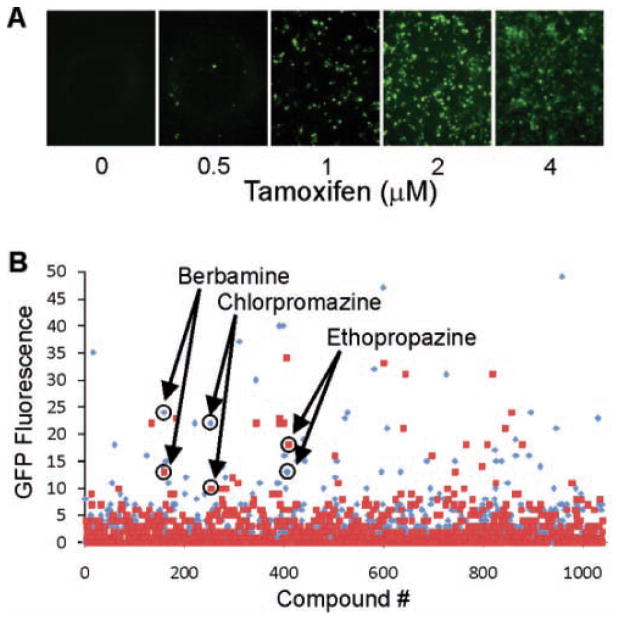
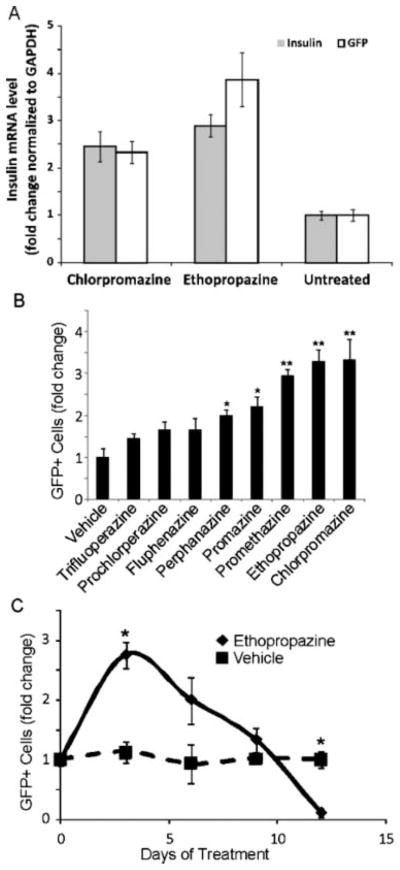
A number of diabetogenic stimuli interact to influence insulin promoter activity, making it an attractive target for both mechanistic studies and therapeutic interventions. High-throughput screening (HTS) for insulin promoter modulators has the potential to reveal novel inputs into the control of that central element of the pancreatic beta-cell. A cell line from human islets in which the expression of insulin and other beta-cell-restricted genes are modulated by an inducible form of the bHLH transcription factor E47 was developed. This cell line, T6PNE, was adapted for HTS by transduction with a vector expressing green fluorescent protein under the control of the human insulin promoter. The resulting cell line was screened against a library of known drugs for those that increase insulin promoter activity. Members of the phenothiazine class of neuroleptics increased insulin gene expression upon short-term exposure. Chronic treatment, however, resulted in suppression of insulin promoter activity, consistent with the effect of phenothiazines observed clinically to induce diabetes in chronically treated patients. In addition to providing insights into previously unrecognized targets and mechanisms of action of phenothiazines, the novel cell line described here provides a broadly applicable platform for mining new molecular drug targets and central regulators of beta-cell differentiated function.
Figures
Similar articles
-
Sterol regulatory element-binding proteins activate insulin gene promoter directly and indirectly through synergy with BETA2/E47.J Biol Chem. 2005 Oct 14;280(41):34577-89. doi: 10.1074/jbc.M506718200. Epub 2005 Jul 29. J Biol Chem. 2005. PMID: 16055439
-
The homeoprotein Alx3 expressed in pancreatic beta-cells regulates insulin gene transcription by interacting with the basic helix-loop-helix protein E47.Mol Endocrinol. 2006 Nov;20(11):2876-89. doi: 10.1210/me.2005-0472. Epub 2006 Jul 6. Mol Endocrinol. 2006. PMID: 16825292
-
A multi-parameter, high-content, high-throughput screening platform to identify natural compounds that modulate insulin and Pdx1 expression.PLoS One. 2010 Sep 23;5(9):e12958. doi: 10.1371/journal.pone.0012958. PLoS One. 2010. PMID: 20886041 Free PMC article.
-
Glucagon-like peptide 1-potentiated insulin secretion and proliferation of pancreatic β-cells.J Diabetes. 2014 Sep;6(5):394-402. doi: 10.1111/1753-0407.12161. Epub 2014 May 22. J Diabetes. 2014. PMID: 24725840 Review.
-
Chemical structure of phenothiazines and their biological activity.Pharmacol Rep. 2012;64(1):16-23. doi: 10.1016/s1734-1140(12)70726-0. Pharmacol Rep. 2012. PMID: 22580516 Review.
Cited by
-
Differential effects, on oncogenic pathway signalling, by derivatives of the HNF4 α inhibitor BI6015.Br J Cancer. 2019 Mar;120(5):488-498. doi: 10.1038/s41416-018-0374-5. Epub 2019 Feb 22. Br J Cancer. 2019. PMID: 30792535 Free PMC article.
-
A novel dual-color reporter for identifying insulin-producing beta-cells and classifying heterogeneity of insulinoma cell lines.PLoS One. 2012;7(4):e35521. doi: 10.1371/journal.pone.0035521. Epub 2012 Apr 18. PLoS One. 2012. PMID: 22530041 Free PMC article.
-
The basic helix-loop-helix transcription factor E47 reprograms human pancreatic cancer cells to a quiescent acinar state with reduced tumorigenic potential.Pancreas. 2015 Jul;44(5):718-27. doi: 10.1097/MPA.0000000000000328. Pancreas. 2015. PMID: 25894862 Free PMC article.
-
Id3 upregulates BrdU incorporation associated with a DNA damage response, not replication, in human pancreatic β-cells.Islets. 2011 Nov-Dec;3(6):358-66. doi: 10.4161/isl.3.6.17923. Epub 2011 Nov 1. Islets. 2011. PMID: 21964314 Free PMC article.
-
A screen for inducers of bHLH activity identifies pitavastatin as a regulator of p21, Rb phosphorylation and E2F target gene expression in pancreatic cancer.Oncotarget. 2017 Jun 21;8(32):53154-53167. doi: 10.18632/oncotarget.18587. eCollection 2017 Aug 8. Oncotarget. 2017. PMID: 28881801 Free PMC article.
References
-
- Porte D, Jr, Kahn SE. The key role of islet dysfunction in type II diabetes mellitus. Clin Invest Med. 1995;18:247–254. - PubMed
-
- Itkin-Ansari P, Marcora E, Geron I, Tyrberg B, Demeterco C, Hao E, et al. NeuroD1 in the endocrine pancreas: localization and dual function as an activator and repressor. Dev Dyn. 2005;233:946–953. - PubMed
Publication types
MeSH terms
Substances
Grants and funding
LinkOut - more resources
Full Text Sources
Other Literature Sources
Medical
Molecular Biology Databases
