. 2010 Aug;22(8):705-16.
doi: 10.1093/intimm/dxq056. Epub 2010 Jun 13.

I-Ag7 is subject to post-translational chaperoning by CLIP

Affiliations

I-Ag7 is subject to post-translational chaperoning by CLIP

Cornelia H Rinderknecht et al. Int Immunol. 2010 Aug.

Abstract

Several MHC class II alleles linked with autoimmune diseases form unusually low-stability complexes with class II-associated invariant chain peptides (CLIP), leading us to hypothesize that this is an important feature contributing to autoimmune pathogenesis. We recently demonstrated a novel post-endoplasmic reticulum (ER) chaperoning role of the CLIP peptides for the murine class II allele I-E(d). In the current study, we tested the generality of this CLIP chaperone function using a series of invariant chain (Ii) mutants designed to have varying CLIP affinity for I-A(g7). In cells expressing these Ii CLIP mutants, I-A(g7) abundance, turnover and antigen presentation are all subject to regulation by CLIP affinity, similar to I-E(d). However, I-A(g7) undergoes much greater quantitative changes than observed for I-E(d). In addition, we find that Ii with a CLIP region optimized for I-A(g7) binding may be preferentially assembled with I-A(g7) even in the presence of higher levels of wild-type Ii. This finding indicates that, although other regions of Ii interact with class II, CLIP binding to the groove is likely to be a dominant event in assembly of nascent class II molecules with Ii in the ER.


Figures

Fig. 1.
Fig. 1.
Select Ii CLIP mutants increase cell surface abundance of I-Ag7. Cell surface levels of I-Ag7 on various cells were assessed by FACS with the mAb OX-6-FITC. The MFI of isotype controls was routinely under 10 (data not shown). MFI of staining on cells expressing mutant Ii is normalized to the appropriate (untagged, 6×His-tagged or 3×FLAG-tagged) wt control within the same experiment. (A) 293T cells were stably transfected with I-Ag7 and single-cell clones were obtained by limiting dilution. A clone expressing moderate levels of I-Ag7 (2A-12) was used to screen Ii mutants for an effect on cell surface levels of I-Ag7. 2A-12 cells were transiently transfected with wt or mutant Ii constructs (closed symbols, untagged Ii; open symbols, 6×His-tagged Ii), and cell surface levels of I-Ag7 were assessed on day 1, 2, 3 and/or 4 after transfection. Data in this figure are from three to seven independent transfections for each mutant. Statistical significance was determined by paired Student’s t-test: **P < 0.01; ***P < 0.001. All seven indicated comparisons remain statistically significant after sequential Bonferroni correction for multiple comparisons. (B) 3A5 and A20 cells expressing I-Ag7 were stably transfected with wt or mutant Ii. Data represent cell surface staining of I-Ag7 on polyclonal populations from two independent transfections and selections. Statistical significance was determined by paired Student’s t-test: *P < 0.05; **P < 0.01; ***P < 0.001. All indicated comparisons remain statistically significant after sequential Bonferroni correction for multiple comparisons. (C) 3A5.g7 cells stably expressing 3xFLAG-tagged wt or mutant Ii were transiently transfected with murine DMα (H-2Mα) by retroviral transduction. In the following days, cells were stained for cell surface I-Ag7 and intracellular DM and 3xFLAG-Ii and were analyzed by FACS. Data are from two independent transfections for M98A and M98D and one transfection for M98S. Left: sample histograms showing cell surface I-Ag7 staining on DM and DM+ populations of 3A5.g7 cells stably expressing 3xFLAG-wt Ii (shaded) or 3xFLAG-M98A Ii (open) and transiently transfected with DM. Right: summary of multiple experiments. In this panel only, MFI represents median fluorescence intensity of I-Ag7 stains (in all other panels, MFI represents mean fluorescence intensity). Note that separation of DM+ and DM- populations by gating in this assay (with this anti-DM reagent) is incomplete, even for A20 versus 3A5. Thus, even conservative DM+/− gates include a proportion of events from the overlapping populations, and the absolute value of changes between populations calculated in this manner is an underestimate (e.g. see reduced scale of mutant Ii effect in cells in DM gate in 1C versus scale of mutant Ii effect in completely DM populations in 1B). Nonetheless, the reduction in mutant Ii effect on cell surface I-Ag7 in the presence of DM is statistically significant as determined by paired Student’s t-test: M98A, P = 0.0005; M98D, P = 0.0005; M98S, P = 0.0025.
Fig. 2.
Fig. 2.
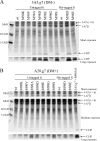
Ii CLIP mutants that increase cell surface I-Ag7 are high-CLIP-affinity mutants within a physiological range of class II/CLIP affinity. 3A5.g7 (A) or A20.g7 (B) cells stably transfected with wt or mutant Ii were labeled with [35S] cysteine and methionine (A, overnight and B, 8 h), and I-Ag7 (I-Adα/I-Ag7β) was immunoprecipitated with the anti-I-Aβ antibody 10-2.16, which does not recognize I-Adβ. Samples were normalized for counts after I-Ag7 IP and analyzed by SDS–PAGE. (Note that the I-Adα band also contains full-length Ii co-precipitated with I-Ag7.) (A) Mutations in Ii that increase cell surface I-Ag7 levels also cause increased persistence of I-Ag7/CLIP co-IP in the absence of DM. Shown: one representative experiment of four. (B) High-affinity mutant CLIP is efficiently removed by DM. Shown: one representative experiment of two.
Fig. 3.
Fig. 3.
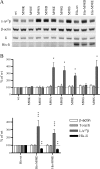
In high-CLIP-affinity Ii transfectants, total cellular abundance of I-Ag7 is increased and abundance of high-CLIP-affinity Ii is decreased. (A) Steady-state levels of I-Ag7β, β-actin, total Ii and transfected 6×His-Ii in stable 3A5.g7 Ii transfectants were assessed by western blotting (antibodies: 10-2.16, anti-actin, In-1 and anti-Tetra-His, respectively). Lysates were normalized for protein amount (shown: 25 μg per lane). One representative experiment of several is shown. (B) Densitometry from several experiments (normalized to the appropriate untagged or 6×His-tagged wt Ii sample within each experiment). Statistical significance was determined by Wilcoxon signed ranks test: *P = 0.0156; **P = 0.0078; ***P < 0.005. All indicated comparisons remain statistically significant after sequential Bonferroni correction for multiple comparisons.
Fig. 4.
Fig. 4.
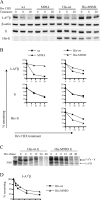
Increased affinity of CLIP for I-Ag7 increases survival time of I-Ag7 and decreases survival time of Ii. (A) 3A5.g7 cells stably expressing wt or mutant Ii were treated with CHX to block de novo protein synthesis. The level of surviving I-Ag7, actin, Ii and His-Ii was assessed by western blot at the indicated time points (using 10-2.16, anti-actin, In-1 and anti-Tetra-His primary antibodies, respectively). Samples are normalized to represent the same number of live cell equivalents (c.eq.) per lane. At the chosen dose of CHX (10 μg ml−1), 3A5 cells ceased to expand but retained >90% viability. Untreated cells expanded exponentially and maintained constant levels of I-Ag7 (per live c.eq.) over the period of observation (data not shown). One representative experiment of two is shown. Each experiment was performed with duplicate gels (one gel with high c.eq. and one gel with low c.eq.) to ensure that detection was in the quantitative range of the assay for each of the four antibodies. Shown: 2x10⁶ c.eq. per lane for I-Ag7β and His-Ii blots and 0.4x10⁶c.eq. per lane from the same samples for actin and total Ii blots. Not shown: the effect of His-M98E on turnover of I-Ag7β and His-Ii was slightly reduced compared with that of His-M98D. (B) Densitometry of the bands shown in A: band intensity was normalized to β-actin band intensity at the same time point and then expressed as % remaining compared with the 0-h time point to illustrate rate of turnover. (C) 3A5.g7 cells stably transfected with His-wt or His-M98D Ii were starved (1 h), labeled with [35S] cysteine and methionine (1 h) and chased for the indicated times. I-Ag7 (I-Adα/I-Ag7β) was immunoprecipitated with 10-2.16. Samples were normalized for starting cell number at time 0 and analyzed by SDS–PAGE. (D) Densitometry of the I-Ag7β bands in C: band intensity was normalized to the 0-h time point from the same sample (shown as % remaining) to illustrate turnover. (12-h time point is omitted for the His-wt Ii series due to distortion of the gel at this lane.)
Fig. 5.
Fig. 5.
Preferential assembly of class II/Ii complexes with increased class II/CLIP affinity. Western blotting was used to detect proportions of I-Ag7β (using 10-2.16 antibody) and transfected, His-tagged Ii (using anti-Tetra His antibody) in whole cell lysates (A, 106 live cell equivalents) or in class II/Ii complexes IPed from whole cell lysates by 10-2.16 (B, anti-I-Ag7β IP from 107 cell equivalents) or by anti-Tetra-His (C, anti-His-tagged Ii IP from 107 cell equivalents) antibodies. In (B), the I-Ag7β and His-Ii bands are indicated by arrows. In the I-Ag7 blot (upper panel), the lower band is the light chain of the 10-2.16 antibody used for the IP, recognized by the goat-anti-mouse IgG2b–HRP secondary reagent in the western blot. In the anti-His blot (middle panel), the upper band is a non-specific band sometimes detected by the anti-Tetra-His antibody, detectable upon lengthy exposure of the film. One representative experiment of three is shown. Densitometry was performed as described in Methods.
Fig. 6.
Fig. 6.
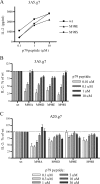
High-CLIP-affinity Ii reduces unsupervised peptide loading. Presentation of the I-Ag7-restricted 1040-79 (p79) mimetope peptide by stable 3A5.g7 or A20.g7 Ii transfectants was detected by a BDC2.5 T-cell hybridoma. IL-2 production was measured by ELISA. (A) Presentation of exogenously added peptide by 3A5.g7 (DM-) Ii transfectants. One representative experiment of five is shown. Data shown as mean of highly reproducible duplicates. (B and C) Summary of data from multiple experiments. For each antigen concentration, IL-2 production is normalized to wt within the same experiment. (B) Presentation of exogenously added p79 peptide by 3A5.g7 transfectants; n = 5 for 0.1, 1 and 10 μM peptide and n = 2 for 0.01 μM peptide. (C) Presentation of exogenously added p79 peptide by A20.g7 transfectants; n = 5 for 0.1, 1 and 10 μM peptide and n = 4 for 0.3, 3 and 30 μM peptide.

Similar articles

Cited by

References

    1. Acha-Orbea H, McDevitt HO. The first external domain of the nonobese diabetic mouse class II I-A beta chain is unique. Proc. Natl Acad. Sci. USA. 1987;84:2435. - PMC - PubMed
    1. Kouskoff V, Korganow AS, Duchatelle V, Degott C, Benoist C, Mathis D. Organ-specific disease provoked by systemic autoimmunity. Cell. 1996;87:811. - PubMed
    1. Kyburz D, Corr M. The KRN mouse model of inflammatory arthritis. Springer Semin. Immunopathol. 2003;25:79. - PubMed
    1. Liu GY, Baker D, Fairchild S, et al. Complete characterization of the expressed immune response genes in Biozzi AB/H mice: structural and functional identity between AB/H and NOD A region molecules. Immunogenetics. 1993;37:296. - PubMed
    1. Suri A, Levisetti MG, Unanue ER. Do the peptide-binding properties of diabetogenic class II molecules explain autoreactivity? Curr. Opin. Immunol. 2008;20:105. - PMC - PubMed

Publication types

MeSH terms