

Changes in the force-velocity relationship of fatigued muscle: implications for power production and possible causes
- PMID: 20547674
- PMCID: PMC2956939
- DOI: 10.1113/jphysiol.2010.190934
Changes in the force-velocity relationship of fatigued muscle: implications for power production and possible causes
Abstract
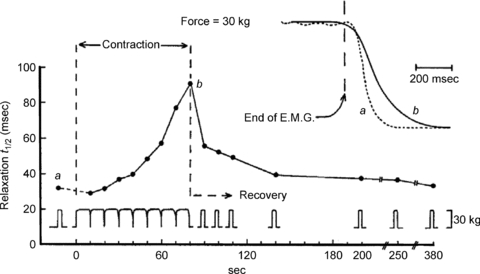
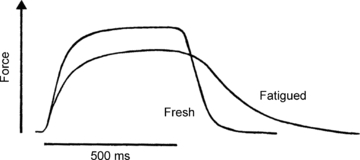
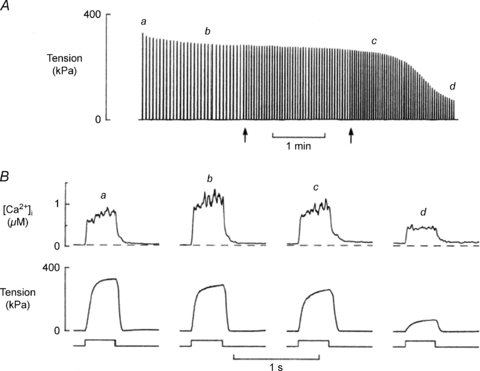
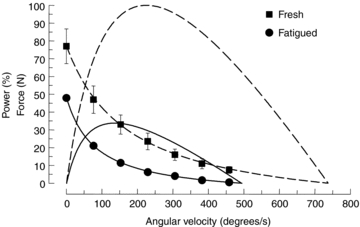
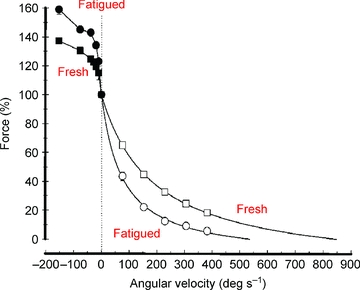
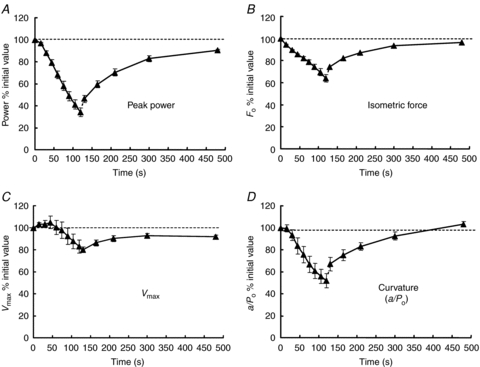
Slowing of the contractile properties of skeletal muscle is one of the characteristic features of fatigue. First studied as a slowing of relaxation from an isometric contraction, it has become apparent that this slowing is indicative of functional changes in muscle responsible for a major loss of power with all its functional repercussions. There are three factors contributing to the loss of power in mammalian muscle at physiological temperatures, a decrease in isometric force, which mainly indicates a reduction in the number of active cross bridges, a slowing of the maximum velocity of unloaded shortening and an increased curvature of the force-velocity relationship. This latter change is a major cause of loss of power but is poorly understood. It is probably associated with an increase in the proportion of cross bridges in the low force state but there are no clear candidates for the metabolic changes that are responsible for this shift in cross bridge states. The possibility is discussed that the reduction in activating calcium that occurs with metabolically depleted muscle, alters the distribution of cross bridge states, affecting both shortening velocity and curvature.
Figures
Similar articles
-
Change in contractile properties of human muscle in relationship to the loss of power and slowing of relaxation seen with fatigue.J Physiol. 2006 Nov 1;576(Pt 3):913-22. doi: 10.1113/jphysiol.2006.116343. Epub 2006 Aug 17. J Physiol. 2006. PMID: 16916911 Free PMC article.
-
Effects of cross-bridge compliance on the force-velocity relationship and muscle power output.PLoS One. 2017 Dec 28;12(12):e0190335. doi: 10.1371/journal.pone.0190335. eCollection 2017. PLoS One. 2017. PMID: 29284062 Free PMC article.
-
Slowed relaxation in fatigued skeletal muscle fibers of Xenopus and Mouse. Contribution of [Ca2+]i and cross-bridges.J Gen Physiol. 1997 Mar;109(3):385-99. doi: 10.1085/jgp.109.3.385. J Gen Physiol. 1997. PMID: 9089444 Free PMC article.
-
Muscle cell function during prolonged activity: cellular mechanisms of fatigue.Exp Physiol. 1995 Jul;80(4):497-527. doi: 10.1113/expphysiol.1995.sp003864. Exp Physiol. 1995. PMID: 7576593 Review.
-
Regulation of contraction in striated muscle.Physiol Rev. 2000 Apr;80(2):853-924. doi: 10.1152/physrev.2000.80.2.853. Physiol Rev. 2000. PMID: 10747208 Review.
Cited by
-
Fatigue is a Brain-Derived Emotion that Regulates the Exercise Behavior to Ensure the Protection of Whole Body Homeostasis.Front Physiol. 2012 Apr 11;3:82. doi: 10.3389/fphys.2012.00082. eCollection 2012. Front Physiol. 2012. PMID: 22514538 Free PMC article.
-
Effects of a Finger Tapping Fatiguing Task on M1-Intracortical Inhibition and Central Drive to the Muscle.Sci Rep. 2018 Jun 19;8(1):9326. doi: 10.1038/s41598-018-27691-9. Sci Rep. 2018. PMID: 29921946 Free PMC article.
-
Hormonal and neuromuscular responses to mechanical vibration applied to upper extremity muscles.PLoS One. 2014 Nov 4;9(11):e111521. doi: 10.1371/journal.pone.0111521. eCollection 2014. PLoS One. 2014. PMID: 25368995 Free PMC article. Clinical Trial.
-
Whole Body Vibration Training Improves Maximal Strength of the Knee Extensors, Time-to-Exhaustion and Attenuates Neuromuscular Fatigue.Sports (Basel). 2023 Apr 25;11(5):94. doi: 10.3390/sports11050094. Sports (Basel). 2023. PMID: 37234050 Free PMC article.
-
Linking in vivo muscle dynamics to force-length and force-velocity properties reveals that guinea fowl lateral gastrocnemius operates at shorter than optimal lengths.J Exp Biol. 2024 Aug 1;227(15):jeb246879. doi: 10.1242/jeb.246879. Epub 2024 Aug 1. J Exp Biol. 2024. PMID: 38873800 Free PMC article.
References
-
- Allen DG, Lamb GD, Westerblad H. Skeletal muscle fatigue: cellular mechanisms. Physiol Rev. 2008;88:287–332. - PubMed
Publication types
MeSH terms
Substances
LinkOut - more resources
Full Text Sources