. 2010 Aug 1;588(Pt 15):2945-60.
doi: 10.1113/jphysiol.2010.191593. Epub 2010 Jun 14.

In vivo expression of G-protein beta1gamma2 dimer in adult mouse skeletal muscle alters L-type calcium current and excitation-contraction coupling

Affiliations

In vivo expression of G-protein beta1gamma2 dimer in adult mouse skeletal muscle alters L-type calcium current and excitation-contraction coupling

Norbert Weiss et al. J Physiol. .

Abstract

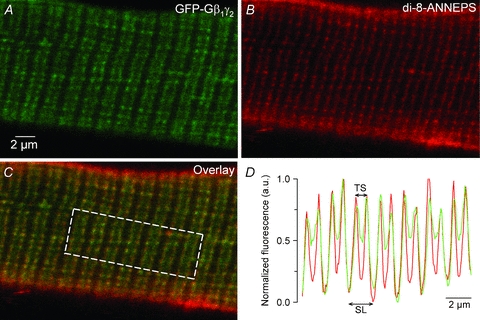
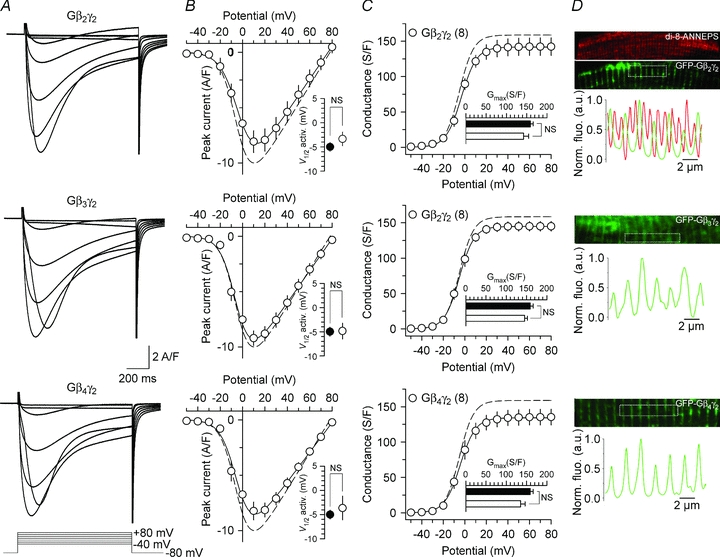
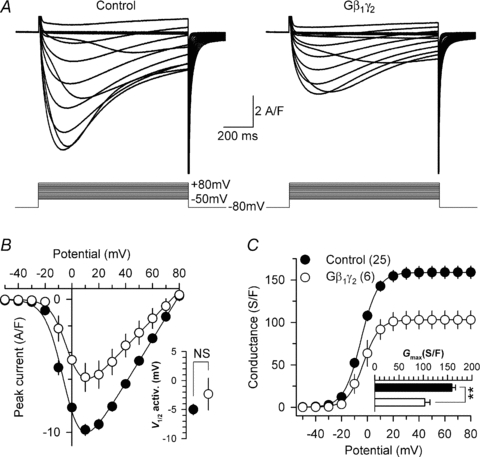
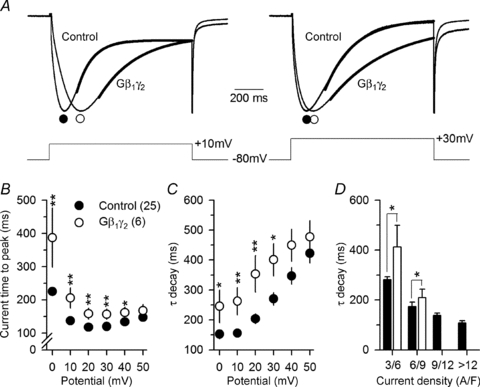
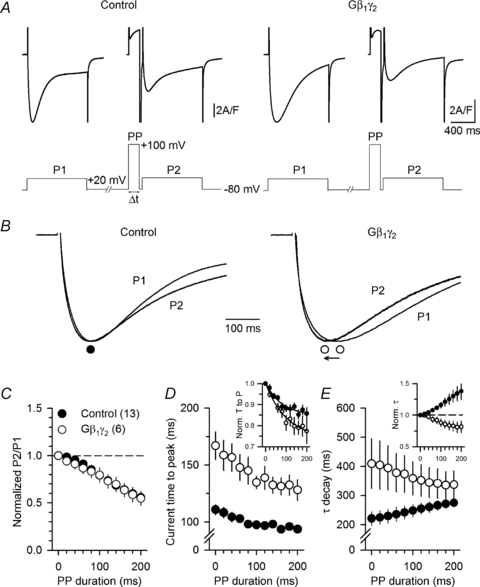
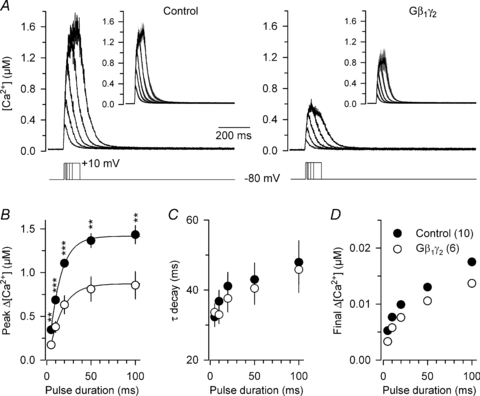
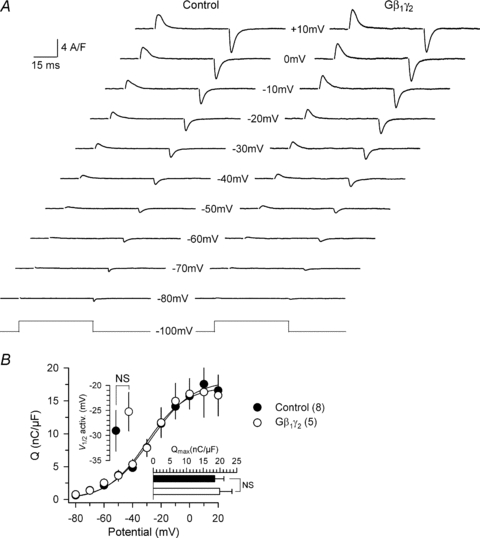
A number of G-protein-coupled receptors are expressed in skeletal muscle but their roles in muscle physiology and downstream effector systems remain poorly investigated. Here we explored the functional importance of the G-protein betagamma (Gbetagamma) signalling pathway on voltage-controlled Ca(2+) homeostasis in single isolated adult skeletal muscle fibres. A GFP-tagged Gbeta(1)gamma(2) dimer was expressed in vivo in mice muscle fibres. The GFP fluorescence pattern was consistent with a Gbeta(1)gamma(2) dimer localization in the transverse-tubule membrane. Membrane current and indo-1 fluorescence measurements performed under voltage-clamp conditions reveal a drastic reduction of both L-type Ca(2+) current density and of peak amplitude of the voltage-activated Ca(2+) transient in Gbeta(1)gamma(2)-expressing fibres. These effects were not observed upon expression of Gbeta(2)gamma(2), Gbeta(3)gamma(2) or Gbeta(4)gamma(2). Our data suggest that the G-protein beta(1)gamma(2) dimer may play an important regulatory role in skeletal muscle excitation-contraction coupling.


Figures

Figure 1
Figure 1. Expression of the GFP-tagged Gβ1γ2 dimer in adult muscle fibres
A, confocal images of the GFP fluorescence from a fibre freshly isolated from a muscle transfected with the cDNAs coding for the GFP–Gβ1 fusion protein along with the Gγ2 subunit. B, di-8-ANNEPS staining. C, overlay of the two images. D, normalized mean fluorescence GFP and di-8-ANNEPS profile along the x axis of the box region superimposed on the image in C. GFP–Gβ1 fusion protein yields subcellular localization consistent with the T-tubule membrane. TS, T-tubule spacing; SL, sarcomere length.
Figure 3
Figure 3. Expression of G-protein β2γ2, β3γ2 or β4γ2 dimers does not alter L-type calcium currents in skeletal muscle fibres
A, representative sets of Ca2+ current traces recorded from a Gβ2γ2 (top panel), Gβ3γ2 (middle panel) and Gβ4γ2 (bottom panel) -expressing fibres in response to 1 s depolarizing steps to values ranging between −40 mV and +80 mV from a holding potential of −80 mV. B, corresponding mean voltage dependence of the peak Ca2+ current density. Inset presents the mean half-maximal activation potential for Gβ2γ2, Gβ3γ2 and Gβ4γ2-expressing fibres. C, corresponding mean values for the voltage dependence of Ca2+ conductance in the three populations. Inset presents the mean maximal conductance for Gβ2γ2, Gβ3γ2 and Gβ4γ2-expressing fibres. The dashed line corresponds to the values from the control fibres. D, expression pattern of the GFP-tagged Gβ2γ2, Gβ3γ2 and Gβ4γ2 dimers in adult muscle fibres. Each panel shows a region of interest selected from a confocal image of the GFP fluorescence (green) of a fibre expressing the given Gβ subunit. The fibre expressing Gβ2γ2 was also stained with di-8-ANNEPS and the corresponding fluorescent image is shown in red. The graph underneath each set of images shows the normalized fluorescence profile of GFP (and di-8-ANNEPS) along the x axis of the boxed region superimposed on each image.
Figure 2
Figure 2. Expression of G-protein β1γ2 dimers reduces L-type calcium current density in skeletal muscle fibres
A, representative sets of Ca2+ current traces recorded from a control (left panel) and from a Gβ1γ2 dimer-expressing fibre (right panel) in response to 1 s depolarizing steps to values ranging between −50 mV and +80 mV from a holding potential of −80 mV. B, corresponding mean voltage dependence of the peak Ca2+ current density. Inset presents the mean half-maximal activation potential for control and Gβ1γ2-expressing fibres. C, corresponding mean values for the voltage dependence of Ca2+ conductance in the two populations. Inset presents the mean maximal conductance for control and Gβ1γ2-expressing fibres. The maximal conductance was reduced by 35% (P= 0.001) in the Gβ1γ2-expressing fibres.
Figure 4
Figure 4. Expression of G-protein β1γ2 dimers slows down L-type calcium current activation and inactivation kinetics
A, normalized Ca2+ current traces recorded from a control and from a Gβ1γ2 dimer-expressing fibre in response to 1 s depolarizing steps to +10 mV (left panel) and +30 mV (right panel) from a holding potential of −80 mV. The continuous superimposed bold lines correspond to the results from fitting a single exponential function to the inactivating phase of the current. B, mean values for the time to peak of the Ca2+ current for control and Gβ1γ2 dimer-expressing fibres. Values were significantly increased in the Gβ1γ2 dimer-expressing fibres for potential values from 0 mV to +40 mV. C, mean values for the time constant τ of Ca2+ current decay. Values were significantly increased in the Gβ1γ2 dimer-expressing fibres at potentials ranging from 0 mV to +30 mV. D, dependence of the time constant of Ca2+ current decay at +10 mV upon the peak current density, in control and Gβ1γ2-expressing fibres. Values for the time constant were grouped into 4 classes of peak current density.
Figure 5
Figure 5. A strong depolarizing pre-pulse allows partial recovery from the slowing of L-type calcium current kinetics induced by Gβ1γ2
A, representative Ca2+ current traces recorded from a control (left panel) and from a Gβ1γ2 dimer-expressing fibre (right panel) in response to a 1 s depolarizing step to +20 mV from a holding potential of −80 mV, before (P1) and after (P2) a strong depolarizing pre-pulse (PP) to +100 mV. B, enlarged view of the Ca2+ current traces shown in A after normalization to the same peak amplitude, with (P2) and without (P1) pre-pulse. C, mean normalized values of P2/P1 peak Ca2+ current amplitude as a function of the pre-pulse (PP) duration. D, mean values for the time to peak of the Ca2+ current recorded in P2 as a function of the pre-pulse duration. The inset shows the corresponding mean values after normalization to the time to peak of the current measured in absence of pre-pulse. E, mean values for the time constant of decay of the Ca2+ current recorded in P2 as a function of the pre-pulse duration. The inset shows the corresponding mean values after normalization to the time constant measured in absence of pre-pulse.
Figure 6
Figure 6. Expression of G-protein β1γ2 dimers strongly alters the voltage-activated Ca2+ transient in skeletal muscle fibres
A, representative indo-1 [Ca2+] traces from a control (left panel) and from a Gβ1γ2 dimer-expressing fibre (right panel) in response to depolarizing steps of increasing duration to +10 mV from a holding potential of −80 mV. The inset in each panel shows the corresponding mean (continuous traces) ±s.e.m. (grey shading) [Ca2+] traces. B–D, corresponding mean ±s.e.m. values of peak change in [Ca2+], time constant (τ) of [Ca2+] decay after the end of the pulse and final change in [Ca2+] level, respectively, measured from 10 control fibres and 6 Gβ1γ2 dimer-expressing fibres. The peak change in [Ca2+] was reduced by 43% (P= 0.0003) (20 ms depolarizing step) in the Gβ1γ2-expressing fibres. Values for the final change in [Ca2+] level were from the exponential fits. When not visible, errors bars are smaller than the mean dot.
Figure 7
Figure 7. Intramembrane charge movement in Gβ1γ2-expressing fibres
A, representative charge movement records from a control fibre and from a GFP-Gβ1γ2-positive fibre, measured in response to 50 ms depolarizing steps to the indicated values of membrane potential. B, mean voltage distribution of the ‘on’ charge in control fibres (n= 8) and in GFP-Gβ1γ2-positive fibre (n= 5). Superimposed continuous lines correspond to a two-state Boltzmann distribution calculated using the mean parameters obtained from fits to the individual sets of data in the two groups of fibres (see text for details).

Similar articles

Cited by

References

    1. Agler HL, Evans J, Tay LH, Anderson MJ, Colecraft HM, Yue DT. G protein-gated inhibitory module of N-type Cav2.2 Ca2+ channels. Neuron. 2005;46:891–904. - PubMed
    1. Arnot MI, Stotz SC, Jarvis SE, Zamponi GW. Differential modulation of N-type 1B and P/Q-type 1A calcium channels by different G protein subunit isoforms. J Physiol. 2000;527:203–212. - PMC - PubMed
    1. Avila G, Aguilar CI, Ramos-Mondragon R. Sustained CGRP1 receptor stimulation modulates development of EC coupling by cAMP/PKA signalling pathway in mouse skeletal myotubes. J Physiol. 2007;584:47–57. - PMC - PubMed
    1. Bannister RA. Bridging the myoplasmic gap: recent developments in skeletal muscle excitation-contraction coupling. J Muscle Res Cell Motil. 2007;28:275–283. - PubMed
    1. Bannister RA, Colecraft HM, Beam KG. Rem inhibits skeletal muscle EC coupling by reducing the number of functional L-type Ca2+ channels. Biophys J. 2008;94:2631–2638. - PMC - PubMed

Publication types