. 2010 Aug;30(16):3956-69.
doi: 10.1128/MCB.00242-10. Epub 2010 Jun 14.

The interaction of Epac1 and Ran promotes Rap1 activation at the nuclear envelope

Affiliations

The interaction of Epac1 and Ran promotes Rap1 activation at the nuclear envelope

Chang Liu et al. Mol Cell Biol. 2010 Aug.

Abstract

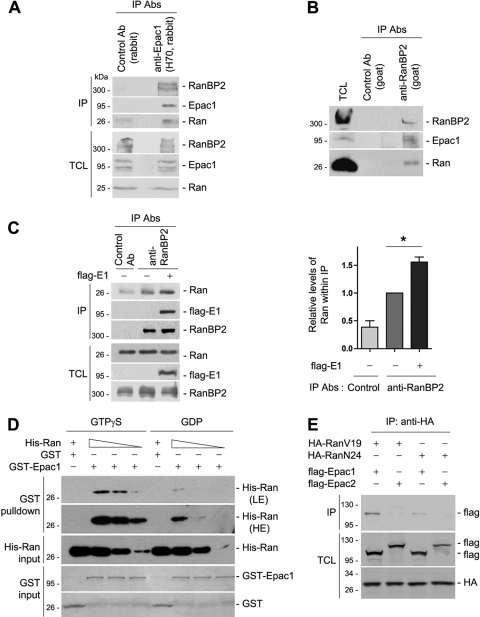
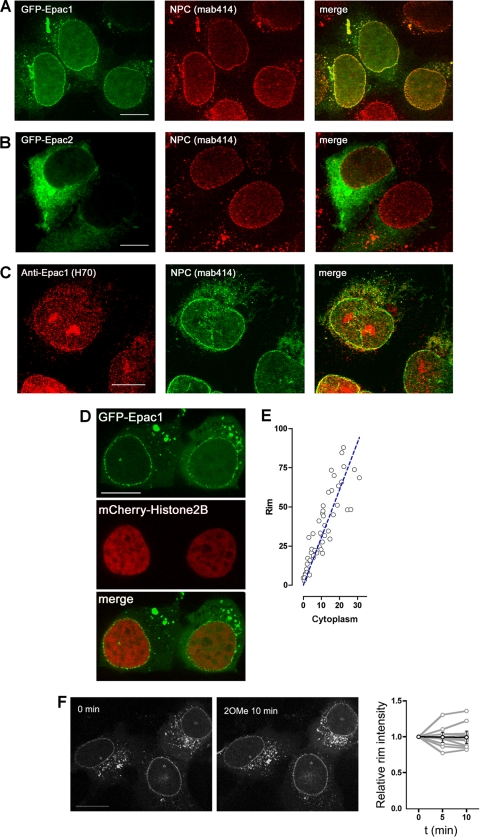
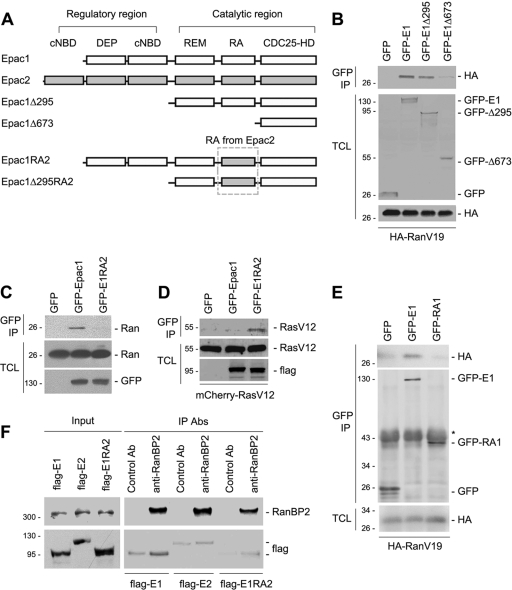
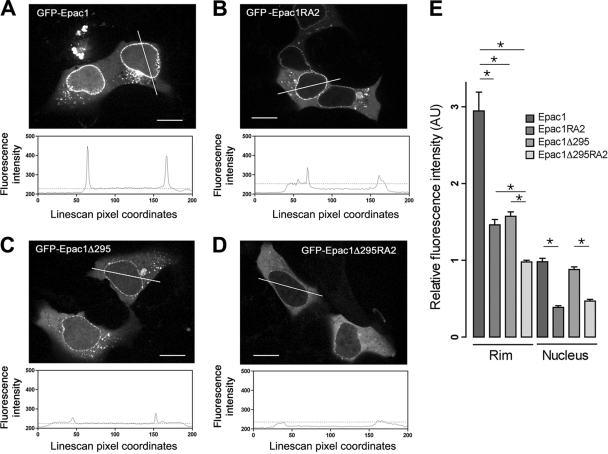
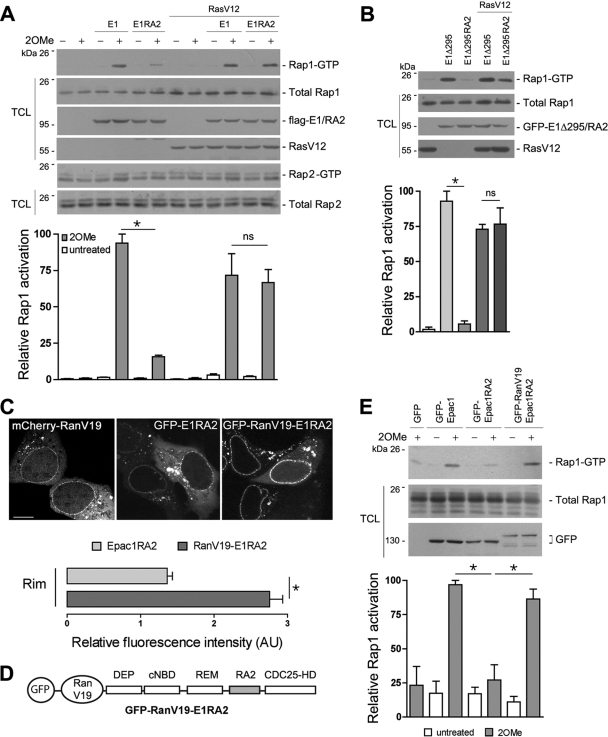
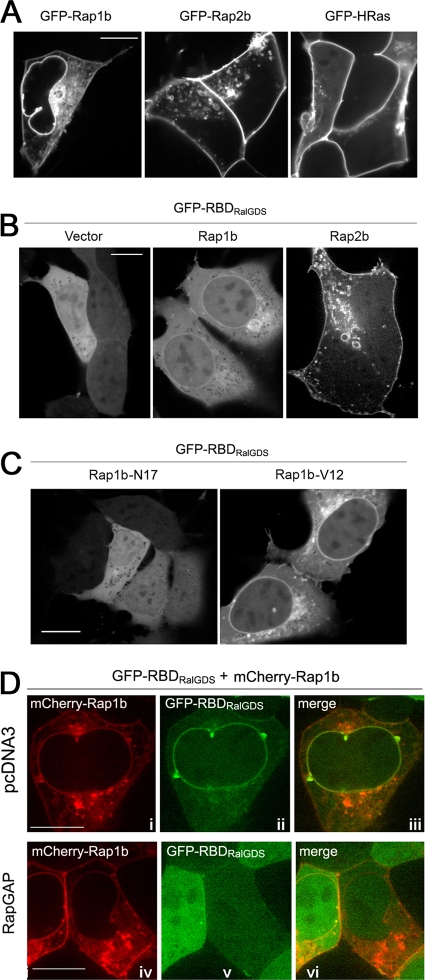
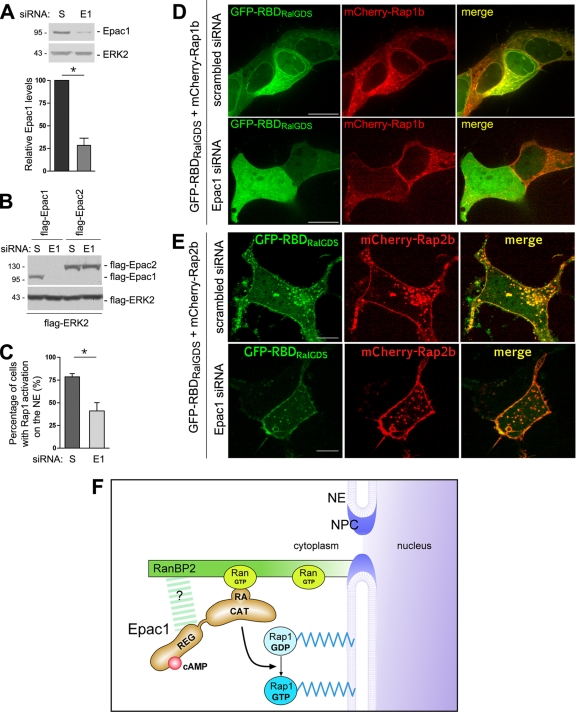
Epac1 (exchange protein directly activated by cyclic AMP [cAMP]) couples intracellular cAMP to the activation of Rap1, a Ras family GTPase that regulates cell adhesion, proliferation, and differentiation. Using mass spectrometry, we identified the small G protein Ran and Ran binding protein 2 (RanBP2) as potential binding partners of Epac1. Ran is a small G protein best known for its role in nuclear transport and can be found at the nuclear pore through its interaction with RanBP2. Here we demonstrate that Ran-GTP and Epac1 interact with each other in vivo and in vitro. This binding requires a previously uncharacterized Ras association (RA) domain in Epac1. Surprisingly, the interaction of Epac1 with Ran is necessary for the efficient activation of Rap1 by Epac1. We propose that Ran and RanBP2 anchor Epac1 to the nuclear pore, permitting cAMP signals to activate Rap1 at the nuclear envelope.


Figures

FIG. 1.
FIG. 1.
Association of Epac1 with Ran and RanBP2. (A) Coimmunoprecipitation (IP) of endogenous Epac1 with Ran and RanBP2 in HEK293 cells. Cell lysates were subjected to IP using anti-Epac1 (H70) and unrelated rabbit IgG as a control. Western blotting was performed using anti-RanBP2 (Novus), anti-Epac1 (H70), and anti-Ran antibodies (Abs). TCL, total-cell lysates. (B) Coimmunoprecipitation of endogenous RanBP2 with Epac1 and Ran in HEK293 cells. Cell lysates were subjected to IP using an anti-RanBP2 antibody (goat) and unrelated goat IgG as a control. The presence of RanBP2, Ran, and Epac1 within the IP was analyzed by Western blotting using anti-RanBP2 (Novus), anti-Epac1 (A5), and anti-Ran. (C) Effect of Epac1 overexpression on the association of RanBP2 and Ran. IP with anti-RanBP2 was performed as for panel B in the presence (+) or absence (−) of Flag-Epac1 (E1), and the presence of Ran, RanBP2, and Flag-Epac1 within the IP was determined by Western blotting. TCL were also determined by Western blotting. The left panel shows one representative result, and the right panel shows the quantification of the results of five independent experiments normalized to the level of Ran seen in the RanBP2 IP in the absence of transfected Epac1 (means ± standard errors of the means; *, P < 0.05). (D) GTP-dependent interaction between Epac1 and Ran in vitro. Increasing amounts of His-Ran loaded with GTPγS or GDP were incubated with GST or GST-Epac1 and were detected by Western blotting using anti-Ran. LE and HE, low and high exposures. GST and GST-Epac1 levels were shown with Coomassie blue. (E) Association of Ran with Epac1 but not Epac2. HA-RanV19 or HA-RanN24 was coexpressed with Flag-tagged Epac1 or Epac2 in HEK293 cells. IP was performed using anti-HA, and Western blotting was performed using anti-Flag and anti-HA. Data shown are representative of at least three independent experiments.
FIG. 2.
FIG. 2.
Colocalization of Epac1 with the nuclear pore complex (NPC). (A) GFP-Epac1 colocalizes with the NPC. HEK293 cells were transfected with GFP-Epac1 (left) (green) and were stained with MAb414 as a primary antibody and Texas Red as a secondary antibody (center) (red) to identify the NPC. A merged image is also shown (right). (B) GFP-Epac2 does not colocalize with the NPC. HEK293 cells were transfected with GFP-Epac2; they were then treated, and are presented, as for panel A. (C) Colocalization of endogenous Epac1 with the NPC. MEL-24 cells were stained with an anti-Epac1 primary antibody and a Texas Red-coupled secondary antibody (left), and with MAb414 as a primary antibody and an FITC-coupled secondary antibody (center). A merged image is also shown (right). (D) Localization of GFP-Epac1 expressed in HEK293 cells by confocal live imaging. mCherry-Histone2B was cotransfected in order to visualize the nuclear chromatin. Bars, 10 μm. (E) Quantification and correlation of the fluorescence intensities of GFP-Epac1 at the perinuclear rim (y axis) and cytoplasm (x axis) in HEK293 cells over a low range of expression levels (see Materials and Methods for details). (F) Effect of 2OMe on Epac1 localization. HEK293 cells were transfected with GFP-Epac1, serum starved, and treated with 2OMe during confocal live imaging. (Left) Representative localizations of GFP-Epac1 before and after 2OMe treatment. (Right) Quantification of the relative intensities of GFP-Epac1 at the perinuclear rim over time normalized to the intensities at 0 min. Gray lines represent changes in the intensities in individual cells (n = 9); the black line and error bars represent means ± standard errors of the means.
FIG. 3.
FIG. 3.
Role of the RA domain in the association of Ran and Epac1. (A) Domain structures of Epac1, Epac2, and the mutants used in the study. cNBD, cyclic-nucleotide-binding domain; DEP, Dishevelled, Egl-10, pleckstrin domain; REM, Ras exchange motif; RA, Ras association domain; CDC25-HD, CDC25-homology domain. Epac1 has one and Epac2 has two cNBDs. (B) Loss of Ran association with Epac1Δ673. HA-RanV19 was coexpressed either with GFP alone or with GFP tagged Epac1 (E1), E1Δ295, or E1Δ673 in HEK293 cells. Immunoprecipitation (IP) was performed using anti-GFP, and Western blotting was performed using anti-GFP and anti-HA. TCL, total-cell lysates. (C) Requirement of the RA domain of Epac1 for Ran-Epac1 association. GFP, GFP-tagged Epac1, and GFP-tagged Epac1RA2 (E1RA2) were expressed in HEK293 cells. IP was performed using anti-GFP, and Western blotting was performed using anti-Ran and anti-GFP. (D) Interaction of E1RA2 and RasV12. pcDNA3, Flag-Epac1, or E1RA2 was coexpressed with mCherry-RasV12 in HEK293 cells. IP was performed using an anti-Flag antibody, and proteins were detected by Western blotting using anti-Ras and anti-Flag. (E) The Epac1 RA domain (RA1) requires additional sequences to bind RanV19. GFP, GFP-tagged Epac1 (E1), or the GFP-tagged RA1 domain alone was cotransfected with HA-RanV19 into HEK293 cells, followed by IP with anti-GFP and Western blotting using anti-HA and anti-GFP. (F) The association of Epac1 and RanBP2 requires an intact RA1 domain of Epac1. HEK293 cells were transfected with Flag-tagged Epac1, Epac2, or Epac1RA2, as indicated, and were subjected to IP using a control antibody (Ab) or anti-RanBP2. (Top) Levels of RanBP2 within the input and IP. (Bottom) Levels of Flag-tagged Epac1, Epac2, and Epac1RA2 within the IP.
FIG. 4.
FIG. 4.
Roles of the RA1 domain and regulatory region in Epac1 localization. (A to D) Localization of GFP-tagged Epac1, Epac1RA2, Epac1Δ295, and Epac1Δ295RA2 in HEK293 cells by confocal live imaging. Upper panels show representative distributions of the indicated constructs. Lower panels show the intensity profiles across the lines in the photos. y axis, fluorescence intensity; x axis, line scan pixel coordinates; dotted lines, levels of fluorescence intensity in the cytoplasm. Bars, 10 μm. (E) Quantification of the relative fluorescence intensities of GFP-tagged Epac1 and mutants at the perinuclear rim and within the nucleus (means ± standard errors of the means; *, P < 0.01). AU, artificial units. See Materials and Methods for details.
FIG. 5.
FIG. 5.
Requirement of the RA1 domain for efficient Rap1 activation via Epac1. (A) Activation of endogenous Rap1 and Rap2 by Epac1 (E1) and Epac1RA2 (E1RA2). (Top) Flag-E1 and Flag-E1RA2 were expressed in HEK293 cells in the absence or presence of mCherry-RasV12. Starved cells were treated with 2OMe for 15 min or were left untreated, and the lysates were assayed for Rap1 and Rap2 activation as described in Materials and Methods. Transfected proteins were blotted with anti-Flag and anti-Ras. (Bottom) Quantification of relative Rap1 activation from three independent experiments (means ± standard errors of the means; *, P < 0.05; ns, not significant). (B) GFP-tagged E1Δ295 and E1Δ295RA2 were expressed in HEK293 cells in the absence or presence of mCherry-RasV12. Rap1 activation was assayed, and is presented, as described for panel A. (C) Comparison of the localizations of mCherry-RanV19, GFP-E1RA2, and GFP-RanV19-E1RA2 in HEK293 cells by confocal live imaging. (Top) Representative images. Bar, 10 μm. (Bottom) Quantification of relative fluorescence intensities of GFP-E1RA2 (light shaded bar) and GFP-RanV19-E1RA2 (dark shaded bar) at the perinuclear rim (means ± standard errors of the means; *, P < 0.01). (D) Schematic of the GFP-RanV19-E1RA2 construct. The domains of Epac1 are listed as in Fig. 3A. The RA domain of Epac2 (RA2) is shaded. (E) Rap1 activation by GFP-RanV19-Epac1RA2. GFP-tagged Epac1, Epac1RA2, and RanV19-Epac1RA2 were expressed in HEK293 cells, which were either treated with 2OMe for 15 min or left untreated. Rap1 activation was assayed, and is presented, as described for panel A.
FIG. 6.
FIG. 6.
Activation of endogenous Rap at the nuclear envelope (NE). (A) Dynamic activation of Rap by Epac1 at the NE. HEK293 cells were cotransfected with GFP-RBDRalGDS and either mCherry-vector (Vector), mCherry-Epac1 (Epac1), or mCherry-Epac1-CAAX (Epac1-CAAX). The cells were treated with 2OMe after serum starvation. Confocal images acquired at the indicated time points are shown (representative of 11 cells for each condition from three independent experiments). Arrowheads indicate the NE. (B) Line scans were performed for the stack of time lapse images at the indicated region of interest (yellow box in panel A, center row, leftmost panel) and were plotted as a colored surface using MatLab. The color scale and the z axis indicate the relative intensities. The x and y axes indicate time (in minutes) and pixel coordinates, respectively. (C) Subcellular localization of Rap activation by Epac1 mutants. mCherry (i), mCherry-tagged Epac1Δ295 (ii), Epac1Δ295RA2 (iii), or RanV19-Epac1Δ295RA2 (iv) was cotransfected with GFP-RBDRalGDS into HEK293 cells. (Top row) GFP; (center row) mCherry; (bottom row) merged images. All images presented were from confocal live imaging and are representative of cells examined in two to three independent experiments (number of cells examined in each condition > 100). Bars, 10 μm.
FIG. 7.
FIG. 7.
Localization and activation of Rap1b at the NE. (A) Localization of GFP-tagged Rap1b, Rap2b, and H-Ras expressed in HEK293 cells, as indicated. All photos presented were from confocal live imaging. Bars, 10 μm. (B) Distribution of GFP-RBDRalGDS in HEK293 cells cotransfected with pcDNA3, Flag-Rap1b, or Flag-Rap2b, as indicated. (C) GTP dependency of the enrichment of GFP-RBDRalGDS on the NE in HEK293 cells cotransfected with GFP-RBDRalGDS and either Rap1b-N17 or Rap1b-V12, as indicated. (D) Inactivation of Rap1b on the NE by RapGAP. GFP-RBDRalGDS and mCherry-Rap1b were cotransfected into HEK293 cells with pcDNA3 (i to iii) or RapGAP (iv to vi), as indicated. (i and iv) mCherry; (ii and v) GFP; (iii and vi) merged images. All the images are representative of cells examined in two to three independent experiments (number of cells examined in each condition > 100).
FIG. 8.
FIG. 8.
Attenuation of Rap1 activation at the NE by depletion of endogenous Epac1. (A) Depletion of Epac1 by siRNA. (Top) Lysates of HEK293 cells transfected with scrambled (S) siRNA or Epac1 siRNA were examined by Western blotting using anti-Epac1 and anti-ERK2 (loading control). (Bottom) Quantification of the results of three experiments (means ± standard errors of the means; *, P < 0.05). (B) Specificity of siRNA for Epac1. HEK293 cells were transfected with Flag-Epac1 or Flag-Epac2 cDNA and either scrambled or Epac1 siRNA, as indicated. The expression of transfected Epac isoforms in the lysates of transfected cells was examined by Western blotting using anti-Flag antibodies. Flag-ERK2 served as a transfection and loading control. (C) Effect of Epac1 depletion on Rap1 activation at the NE. GFP-RBDRalGDS and mCherry-Rap1b were cotransfected with scrambled or Epac1 siRNA in HEK293 cells. The percentages of cells with enrichment of GFP-RBDRalGDS on the NE were quantified from four independent experiments (means ± standard errors of the means; *, P < 0.01). (D) Representative images from the experiment for which results are shown in panel C. The top and bottom panels show cells cotransfected with scrambled and Epac1 siRNA, respectively. (Left) GFP; (center) mCherry; (right) merged images. Bar, 10 μm. (E) Effect of Epac1 depletion on Rap2 activation. GFP-RBDRalGDS and mCherry-Rap2b were cotransfected with scrambled (top) or Epac1 (bottom) siRNA in HEK293 cells. (Left) GFP; (center) mCherry; (right) merged images. Bar, 10 μm. (F) Model for anchored Epac1 signaling at the NE. The NPC is a large multimeric protein complex, shown in cross section, spanning the double bilayer of the NE. Epac1 is localized to the NPC through direct interaction between its RA domain and Ran-GTP, which also associates with RanBP2, the major nucleoporin on the cytoplasmic face of the NPC. Epac1 may also make direct contacts with RanBP2 as shown (question mark). The anchored Epac1 allows cAMP to activate local pools of Rap1 that are tethered on the NE.

Similar articles

Cited by

References

    1. Baillie, G. S. 2009. Compartmentalized signalling: spatial regulation of cAMP by the action of compartmentalized phosphodiesterases. FEBS J. 276:1790-1799. - PubMed
    1. Baljinnyam, E., K. Iwatsubo, R. Kurotani, X. Wang, C. Ulucan, M. Iwatsubo, D. Lagunoff, and Y. Ishikawa. 2009. Epac increases melanoma cell migration by a heparan sulfate-related mechanism. Am. J. Physiol. Cell Physiol. 297:C802-C813. - PMC - PubMed
    1. Bivona, T. G., and M. R. Philips. 2005. Analysis of Ras and Rap activation in living cells using fluorescent Ras binding domains. Methods Enzymol. 37:138-145. - PubMed
    1. Bivona, T. G., H. H. Wiener, I. M. Ahearn, J. Silletti, V. K. Chiu, and M. R. Philips. 2004. Rap1 up-regulation and activation on plasma membrane regulates T cell adhesion. J. Cell Biol. 164:461-470. - PMC - PubMed
    1. Bolger, G. B., G. S. Baillie, X. Li, M. J. Lynch, P. Herzyk, A. Mohamed, L. H. Mitchell, A. McCahill, C. Hundsrucker, E. Klussmann, D. R. Adams, and M. D. Houslay. 2006. Scanning peptide array analyses identify overlapping binding sites for the signalling scaffold proteins, beta-arrestin and RACK1, in cAMP-specific phosphodiesterase PDE4D5. Biochem. J. 398:23-36. - PMC - PubMed

Publication types

MeSH terms