. 2010 Aug 20;285(34):26628-40.
doi: 10.1074/jbc.M109.095109. Epub 2010 Jun 14.

Influence of heparin mimetics on assembly of the FGF.FGFR4 signaling complex

Affiliations

Influence of heparin mimetics on assembly of the FGF.FGFR4 signaling complex

Krishna Saxena et al. J Biol Chem. .

Abstract

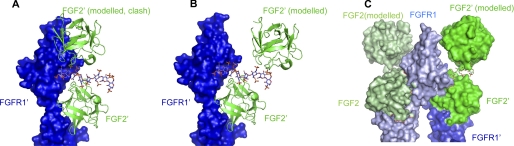
Fibroblast growth factor (FGF) signaling regulates mammalian development and metabolism, and its dysregulation is implicated in many inherited and acquired diseases, including cancer. Heparan sulfate glycosaminoglycans (HSGAGs) are essential for FGF signaling as they promote FGF.FGF receptor (FGFR) binding and dimerization. Using novel organic synthesis protocols to prepare homogeneously sulfated heparin mimetics (HM), including hexasaccharide (HM(6)), octasaccharide (HM(8)), and decasaccharide (HM(10)), we tested the ability of these HM to support FGF1 and FGF2 signaling through FGFR4. Biological assays show that both HM(8) and HM(10) are significantly more potent than HM(6) in promoting FGF2-mediated FGFR4 signaling. In contrast, all three HM have comparable activity in promoting FGF1.FGFR4 signaling. To understand the molecular basis for these differential activities in FGF1/2.FGFR4 signaling, we used NMR spectroscopy, isothermal titration calorimetry, and size-exclusion chromatography to characterize binding interactions of FGF1/2 with the isolated Ig-domain 2 (D2) of FGFR4 in the presence of HM, and binary interactions of FGFs and D2 with HM. Our data confirm the existence of both a secondary FGF1.FGFR4 interaction site and a direct FGFR4.FGFR4 interaction site thus supporting the formation of the symmetric mode of FGF.FGFR dimerization in solution. Moreover, our results show that the observed higher activity of HM(8) relative to HM(6) in stimulating FGF2.FGFR4 signaling correlates with the higher affinity of HM(8) to bind and dimerize FGF2. Notably FGF2.HM(8) exhibits pronounced positive binding cooperativity. Based on our findings we propose a refined symmetric FGF.FGFR dimerization model, which incorporates the differential ability of HM to dimerize FGFs.


Figures

FIGURE 1.
FIGURE 1.
Effect of HM6, HM8, and HM10 addition on FGFR4 sensitivity to FGF1/2 in a BaF/3 FGFR4-hMpl proliferation assay. A, constitution of the heparin-mimetics decasaccharide HM10, octasaccharide HM8, and hexasaccharide HM6. The residue nomenclature used in the text is indicated. The non-reducing end of the oligosaccharides is shown on the left side. IdoA: α-l-iduronic acid; GlcN: α-d-glucosamine. B, increasing doses of FGF1 or FGF2 have been used in the absence and presence of 100 nm HM of different lengths. C, EC50 values of FGF1 or FGF2 with or without HM have been calculated and are given in the table.
FIGURE 2.
FIGURE 2.
Two-dimensional NMR results of the FGFR4 D2·FGF1·HM8 complex mapped onto the x-ray structure of the ternary complex of FGFR1·FGF2·HM10 (1FQ9) in two different views. FGFR1 and FGF2 are represented by blue and green surfaces, respectively; one heteromeric half (FGFR1·FGF2) is depicted in light colors, the second one (FGFR1′·FGF2′) in dark colors; HM are displayed as a stick model. Strong amide signal broadening and CSPs larger than 0.03 ppm are colored in red. A, NMR mapping of 15N FGFR4 D2 amide signals with strong line broadening observed upon addition of unlabeled FGF1·HM8 complexes. The affected residues are located at the interface between FGF, FGFR, and HM8. In addition to the FGF·FGFR interaction sites within the heteromeric half complexes (FGFR·FGF or FGFR′·FGF′), also interactions between the heteromeric half complexes (FGFR·FGFR′ (cyan circles); FGFR·FGF′ and FGFR′·FGF (yellow circles)) are detected. Orange circles indicate the receptor-receptor-contacts only seen in the asymmetric x-ray structure (Fig. 3). B, NMR mapping of 15N FGF1 amide signals with strong line broadening observed upon addition of unlabeled FGFR4 D2 in the presence of HM8. The interaction sites between FGF and HM8 as well as the binding surface to FGFR and FGFR′ are affected. The unique FGF-heparin interaction of the asymmetric x-ray structure is depicted as a dark blue circle.
FIGURE 3.
FIGURE 3.
Mapping of the CSP results explained in Fig. 2 (same representation and color coding) to the asymmetric complex of FGFR2 D2D3·FGF1·heparin (1E0O). Surface areas where CSP data confirm the symmetric model (1FQ9, Fig. 2) but do not fit to the depicted complex are marked with circles: yellow and cyan circles show contacts in 1FQ9 between an FGF and a receptor molecule and between two receptor molecules, respectively. Dark blue circles mark contacts between heparin and FGF, and orange circles between the two receptor molecules present in 1E0O that could not be confirmed by CSP data.
FIGURE 4.
FIGURE 4.
HM·FGF2 interaction (A and B). Anomeric regions of the one-dimensional 1H NMR spectra of HM6 (A) and HM8 (B) in the absence (bottom) and presence (top) of FGF2 are shown. Spectra were recorded with 50 μm HM and 50 μm FGF2 in 50 mm NaH2PO4/Na2HPO4 buffer, pH 6.8, 100 mm NaCl. C and D, ITC titrations of FGF with heparin mimetics. C, sample titration of FGF2 with HM8. Top panel: raw heating power data; the first peak represents a small pre-injection (5 μl) that is omitted in the integrated data. Bottom panel: data after peak integration and concentration normalization. Curve fit of the data to a single site binding model. D, isotherms for binding of HM6 (open squares) or HM8 (filled squares) to FGF1, and for binding of HM6 (open triangles) or HM8 (filled triangles) to FGF2. Dotted vertical lines indicate the equivalence point of the titrations with HM6 and HM8 at a molar ratio (HM:FGF) of 1 and 0.5. The sample cell contained 5 μm FGF, and HM were titrated from a 65 μm stock solution. Measurement conditions: see Table 2. E, HM-induced FGF2 dimerization determined by NMR 1H T2 relaxation. Apparent molecular weight of FGF2 upon titration with HM6 (open triangles) and HM8 (filled triangles) determined from 1H T2 measurements of the bulk imino protons at 30 μm FGF2 concentration. Equilibrium concentrations and apparent molecular masses were fitted assuming the two-step mechanism depicted in F as a model. A least square fit to the experimental data was performed by variation of KD1 and KD2. The fitted theoretical masses are depicted as solid lines. For HM6, KD1 = 160 nm and KD2 = 120 nm were found, for HM8, KD1 = 100 nm and KD2 = 5.8 nm. F, the assumed two-step interaction scheme of FGF2 (gray) with HM (black) with binding constants KD1 and KD2.
FIGURE 5.
FIGURE 5.
FGF·FGFR·HM assembly model. Model for the interaction of HM6 (A) and HM8 (B) with FGF2 and FGFR. The oligosaccharides are symbolized by white balls for IdoA, and black balls for GlcN, and the sulfate groups are indicated by small gray balls. The carboxylate group of IdoA is shown as small white ball. The sulfate group at the non-reducing end of HM, which is required for interaction with the receptor, is depicted in red. A, the first association of FGF2 to the HM6 (I) is possible in two ways for HM6 (IIa and IIb). The following dimerization step leads to one unique species (III). Direct binding of this complex to the receptor (IVa) is not possible for sterical reasons. The 1:1:1 FGF2·FGFR·HM complex (IVb) can either be formed by interaction of the FGF2·HM6 complex IIb with FGFR or in a concerted step of binding of (FGF2)2·HM6 to the receptor and simultaneously dissociation of the second FGF. B, HM8 (I) can form three different 1:1 FGF·heparin complexes (IIa, IIb, and IIc). The dimerization step can lead to two different FGF2 dimer forms (IIIa and IIIb). The favored (FGF2)2·HM8 complex (IIIb) can then form a 2:1:1 FGF2·FGFR·HM8 complex (IVb) or dimerize to a 4:2:2 FGF2·FGFR·HM8 complex. Alternatively, the ternary 1:1:1 complex (V) formed from the interaction of FGFR·FGF2·HM8 complex (IIb) with FGFR can also result to a signaling competent assembly (2:2:2).
FIGURE 6.
FIGURE 6.
Modeled structures of FGF2·FGFR·HM complexes based on the symmetric ternary complex (1FQ9). A and B, FGF2 modeled to the 1:1:1 FGF2·FGFR1 D2D3·HM8 heteromeric half-complex of the crystal structure. FGF2 is depicted as green schematics, HM in sticks. FGFR1 D2D3 is symbolized by a blue surface. A, modeled structure according to the HM6 like (FGF2)2·HM complex (Fig. 5, A and B, IVa). FGFR1 D2 and FGF2 overlap sterically. This complex cannot be formed. B, modeled structure with the second possible (FGF2)2·HM8 binding mode (Fig. 5B, IVb). No sterical clashes indicate that this complex is a possible intermediate of ternary complex formation. C, modeled ternary complex of a 4:2:2 FGF·FGFR·HM stoichiometry according to the heteromeric half-complexes depicted in B. This proposed complex is sterically possible as an intermediate assembly state for FGF-induced FGFR signaling.

Similar articles

Cited by

References

    1. Ornitz D. M., Itoh N. (2001) Genome Biol. 2, REVIEWS3005 - PMC - PubMed
    1. Popovici C., Roubin R., Coulier F., Birnbaum D. (2005) Bioessays 27, 849–857 - PubMed
    1. Eswarakumar V. P., Lax I., Schlessinger J. (2005) Cytokine Growth Factor Rev. 16, 139–149 - PubMed
    1. Beenken A., Mohammadi M. (2009) Nat. Rev. Drug Discovery 8, 235–253 - PMC - PubMed
    1. Ornitz D. M. (2005) Cytokine Growth Factor Rev. 16, 205–213 - PMC - PubMed