. 2010 Jul;59(4):400-14.
doi: 10.1093/sysbio/syq024. Epub 2010 May 24.

Species delimitation using a combined coalescent and information-theoretic approach: an example from North American Myotis bats

Affiliations

Species delimitation using a combined coalescent and information-theoretic approach: an example from North American Myotis bats

Bryan C Carstens et al. Syst Biol. 2010 Jul.

Abstract

Coalescent model-based methods for phylogeny estimation force systematists to confront issues related to the identification of species boundaries. Unlike conventional phylogenetic analysis, where species membership can be assessed qualitatively after the phylogeny is estimated, the phylogenies that are estimated under a coalescent model treat aggregates of individuals as the operational taxonomic units and thus require a priori definition of these sets because the models assume that the alleles in a given lineage are sampled from a single panmictic population. Fortunately, the use of coalescent model-based approaches allows systematists to conduct probabilistic tests of species limits by calculating the probability of competing models of lineage composition. Here, we conduct the first exploration of the issues related to applying such tests to a complex empirical system. Sequence data from multiple loci were used to assess species limits and phylogeny in a clade of North American Myotis bats. After estimating gene trees at each locus, the likelihood of models representing all hierarchical permutations of lineage composition was calculated and Akaike information criterion scores were computed. Metrics borrowed from information theory suggest that there is strong support for several models that include multiple evolutionary lineages within the currently described species Myotis lucifugus and M. evotis. Although these results are preliminary, they illustrate the practical importance of coupled species delimitation and phylogeny estimation.


Figures

F<sc>IGURE</sc> 1.
FIGURE 1.
Species phylogenies used in the false lumping/splitting simulations. Branch lengths are in units of N generations, and genealogies were simulated using θ = 10.0.
F<sc>IGURE</sc> 2.
FIGURE 2.
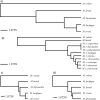
Species trees estimated using STEM. a) Shows the species tree estimated using the species as OTUs and only the clocklike loci, whereas (b) shows the species tree estimated using the subspecies as OTUs. c) Shows the species tree estimated using all loci, including those that violate the molecular clock assumption. d) Shows the topology estimated when only the non-clocklike loci are used. Note that the trees shown in (a) and (b) are drawn to equivalent scales, as are the trees shown in (c) and (d).
F<sc>IGURE</sc> 3.
FIGURE 3.
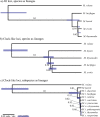
Representation of the posterior distribution of species tree space from a BEST analysis. a) Shows the species tree estimated using species as OTUs and all loci, whereas (b) shows the species tree estimated using the 3 loci that were consistent with the molecular clock. c) Shows phylogeny estimate from the clocklike loci and subspecies as OTUs. For each, the branches are the mean values of all tree in the posterior distribution, the shaded bars represent the 95% highest posterior density interval of branch lengths, and the numbers above each branch depict the Bayesian posterior probabilities of each node.
F<sc>IGURE</sc> 4.
FIGURE 4.
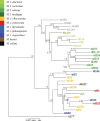
Phylogeny estimated from the concatenated data. Unlike the other methods used to estimate phylogeny, individuals serve as the OTUs in this phylogeny. We randomly chose one of the phased alleles from the nuclear loci and combined them with the cytochrome b data, we then repeated the analysis with the other set of alleles. Shown is the tree from one run, the other was broadly similar. Samples are color-coded to subspecies using the colors shown to the left of the phylogeny.
F<sc>IGURE</sc> 5.
FIGURE 5.
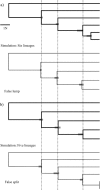
Example results from simulation exploration of species delimitation using STEM. a) Shows the average of species tree estimates made using 10 loci with 6 lineages as OTUs (phylogeny with thick lines) and the effects of falsely lumping 2 lineages together. b) Shows the effects of falsely splitting a single lineage. In all cases, the topology is consistent, and the species tree estimated using the correct assignment of individuals to lineages is essentially identical to that used for the simulations. Shaded boxes represent the 95% confidence interval of branch length for the species tree estimates.

Similar articles

Cited by

References

    1. Akaike H. Information theory as an extension of the maximum likelihood principle. In: Petrov BN, Csaki F, editors. Second International Symposium on Information Theory. Budapest (Hungary): Akademiai Kiado; 1973. pp. 267–281.
    1. Anderson DR. Model based inference in the life sciences. New York: Springer; 2008.
    1. Ané C, Larget B, Baum DA, Smith SD, Rokas A. Bayesian estimation of concordance among gene trees. Mol. Biol. Evol. 2007;24:412–426. - PubMed
    1. Baker RH, Stains HJ. A new long-eared Myotis (Myotis evotis) from northeastern Mexico. Univ. Kansas Mus. Nat. Hist. 1955;9:81–84.
    1. Beerli P, Felsenstein J. Maximum likelihood estimation of a migration matrix and effective population sizes in n subpopulations by using a coalescent approach. Proc. Natl. Acad. Sci. USA. 2001;98:4563–4568. - PMC - PubMed

Publication types