. 2010 Jul 5;207(7):1409-20.
doi: 10.1084/jem.20091885. Epub 2010 Jun 14.

Pathogen-specific regulatory T cells delay the arrival of effector T cells in the lung during early tuberculosis

Affiliations

Pathogen-specific regulatory T cells delay the arrival of effector T cells in the lung during early tuberculosis

Shahin Shafiani et al. J Exp Med. .

Abstract

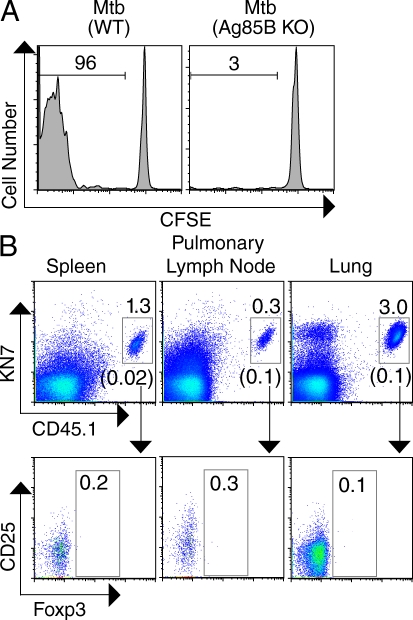
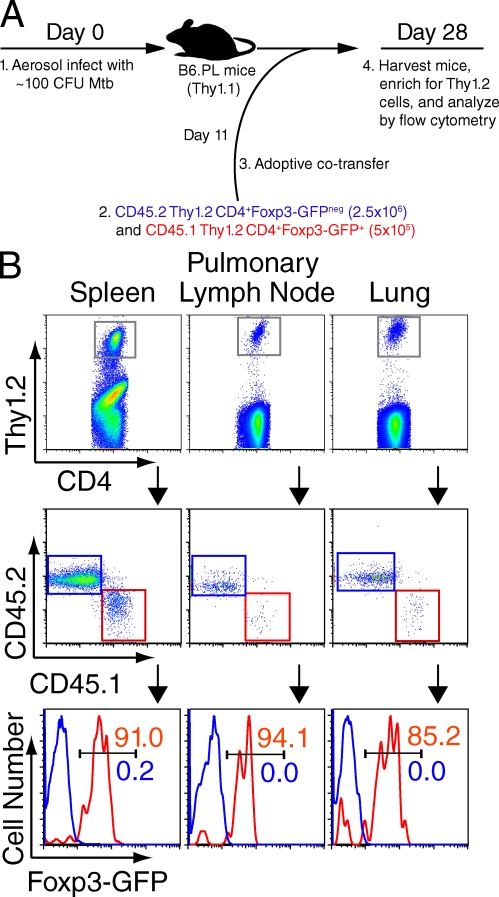
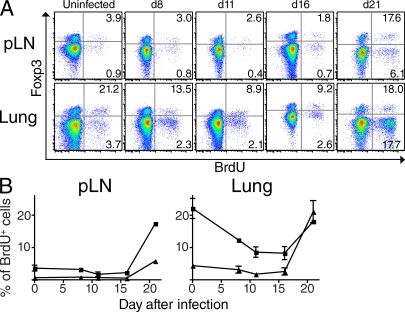
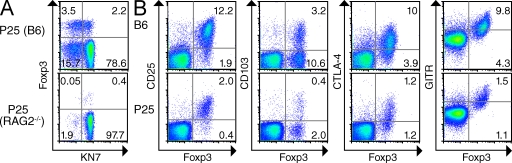
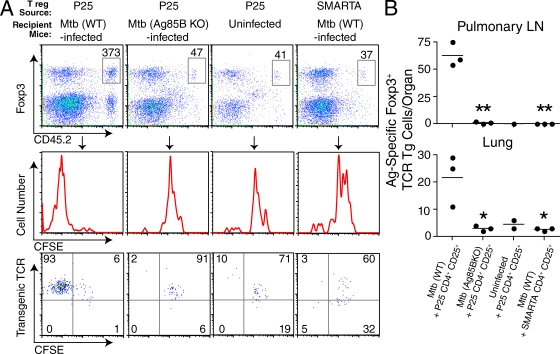
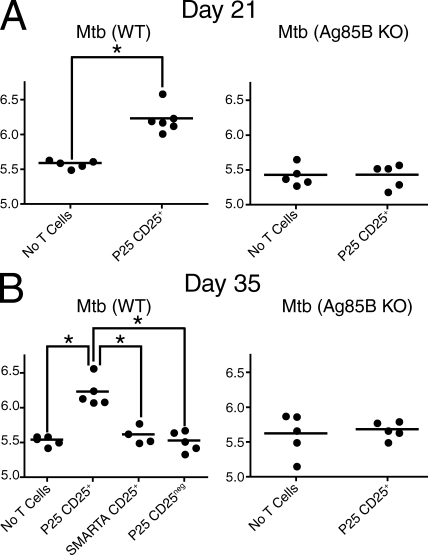
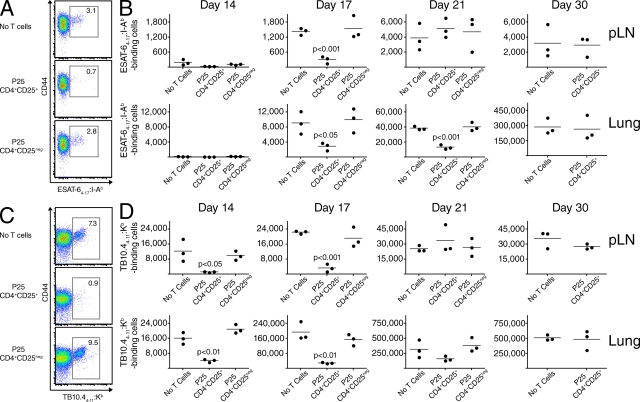
The ability of the adaptive immune system to restrict Mycobacterium tuberculosis (Mtb) is impeded by activated Foxp3(+) regulatory T (T reg) cells. The importance of pathogen-specific T reg cells in this process has not been addressed. We show that T reg cell expansion after aerosol Mtb infection does not occur until Mtb is transported to the pulmonary lymph node (pLN), and Mtb-specific T reg cells have an increased propensity to proliferate. Even small numbers of Mtb-specific T reg cells are capable of delaying the priming of effector CD4(+) and CD8(+) T cells in the pLN and their subsequent accumulation in the lung, the primary site of infection. This delay likely prolongs the initial phase of bacterial expansion and explains the higher bacterial burden observed in these mice. Thus, T reg cells recognizing Mtb-derived antigens specifically and potently restrict protective immune responses during tuberculosis.


Figures

Figure 1.
Figure 1.
Foxp3 expression is not induced in Mtb-specific, transgenic CD4+ T cells during early Mtb infection. (A) Proliferation of CFSE-labeled CD4+ T cells (105 cells transferred) from CD45.1 P25 TCR transgenic mice (analyzed on day 18 after infection) 6 d after transfer into Mtb (WT)– or Mtb (Ag85B KO)–infected B6 mice. Numbers represent the percentage of proliferating CD45.1 CD4+ T cells in the spleen as measured by CFSE dilution. (B, top) Transgenic TCR (detected by KN7 anticlonotypic antibody for the P25 transgenic TCR) and CD45.1 expression on gated CD4+ cells from the spleen, pLN, and lung of Mtb-infected B6 mice, transferred on day 11 and analyzed on day 26 after infection. Numbers shown above the gray gates represent the percentage of transferred KN7+ CD45.1 cells within the CD4+ cells in each tissue, and the numbers shown in parenthesis below the gates represent the corresponding percentages in uninfected controls. (bottom) The expression of CD25 and Foxp3 by cells within the KN7+ CD45.1 population; numbers represent the percentage of Foxp3+ cells within this gate. Each experiment was performed three times with three Mtb-infected mice per group. Results from representative mice are shown.
Figure 2.
Figure 2.
Foxp3 expression is not induced in endogenous CD4+ T cells during early Mtb infection. (A) Schematic of experimental design. 2.5 × 10⁶ conventional CD4+ T cells (blue) and 5 × 10⁵ T reg cells (red) were transferred on day 11 and analyzed on day 28 after infection. (B, top) Gated CD4+ T cells; the gray gate represents the transferred Thy1.2 cells within these populations in the enriched spleen, pLN, and lung. (middle) CD45.2 (blue gate) and CD45.1 cells (red gate) within the Thy1.2 populations. (bottom) Foxp3-GFP expression within CD45.2 (blue histograms, representing cells sorted and transferred as Foxp3-GFPneg cells) and CD45.1 cells (red histograms, representing cells sorted and transferred as Foxp3-GFP+ cells). Percentages of cells are shown. The experiment was performed three times with three mice per group in each experiment. Results from representative mice are shown.
Figure 3.
Figure 3.
Proliferation of endogenous T reg cells is delayed similarly to effector T cell proliferation. (A) Representative BrdU incorporation of CD4+-gated T cells in the pLNs (top) or lungs (bottom) of uninfected or Mtb-infected mice at various time points after aerosol infection. Mice were administered 1 mg BrdU intraperitoneally 20 h before analysis. Numerical values represent the percentage of Foxp3+ (top right quadrant) and Foxp3 cells (bottom right quadrant) that incorporated BrdU. (B) Cumulative data showing the frequency of Foxp3-expressing CD4+ T cells (squares) and Foxp3 CD4+ T cells (triangles) that incorporated BrdU in the pLNs or lungs of mice at various time points after Mtb infection. Means and SEM of three mice per group at each time point are shown. Data are representative of two independently performed experiments.
Figure 4.
Figure 4.
P25 mice contain a population of pathogen-specific T reg cells. (A) Expression of Foxp3 and transgenic TCR (detected by KN7 antibody) on CD4-gated spleen cells from P25 mice on WT B6 or RAG2−/− (bottom) backgrounds. The percentage of cells within each quadrant is shown. (B) Expression of the indicated markers by CD4-gated spleen cells from B6 mice (top) or KN7+CD4+ spleen cells from P25 mice (bottom). Numbers represent the frequency of cells in the indicated quadrants. The experiment was performed twice with three mice per group in each experiment. Results from representative mice are shown.
Figure 5.
Figure 5.
Preferential expansion of T reg cells recognizing Mtb-derived antigens. (A, top) Expression of Foxp3 and CD45.2 on gated CD4+ CD45.2-enriched spleen cells from Mtb (WT)–infected, Mtb (Ag85B KO)–infected, or uninfected mice receiving 105 CFSE-labeled CD4+CD25+ T cells from P25 or SMARTA TCR transgenic mice, as indicated. T reg cells were transferred on day 15 and analyzed on day 20 after infection. Numerical values represent the absolute number of CD45.2 CD4+ Foxp3+ cells recovered from the spleen of a representative mouse from each group. (middle) The degree of proliferation (CFSE dilution) exhibited by these cells. (bottom) Expression of transgenic TCR (i.e., KN7 for P25 and Vα2 for SMARTA T reg cells) and CFSE. Numbers represent the frequency of cells in each quadrant. (B) Circles represent the absolute number of antigen-specific P25 or SMARTA T reg cells recovered from the pLN (top) or lung (bottom) from individual mice, and bars indicate the mean of each group. The experiment was performed three times with three mice per group in each experiment. Results from representative mice are shown in A. An unpaired Student’s t test was performed, and p-values for groups significantly different from the Mtb (WT) + P25 CD4+CD25+ group are indicated (*, P < 0.05; **, P < 0.001).
Figure 6.
Figure 6.
Pathogen-specific T reg cells suppress protective immunity in TB. (A) Day 21 lung CFU analysis of Mtb (WT)– or Mtb (Ag85B KO)–infected mice that received either no T cells or CD4+CD25+ T cells from P25 mice intravenously on day 11 after infection (4 × 10⁴ cells/mouse). (B) Day 35 lung CFU analysis of Mtb (WT)– or Mtb (Ag85B KO)–infected mice that received either no T cells or P25 CD4+CD25+, SMARTA CD4+CD25+, or P25 CD4+CD25neg T cells intravenously on day 11 after infection (105 cells/mouse), as indicated. Circles represent individual mice and bars represent the mean of each group (*, P < 0.01, unpaired Student’s t test). The experiment was performed three times at day 21 and once at day 35 with five mice per group in each experiment.
Figure 7.
Figure 7.
Mtb-specific T reg cells delay effector T cell expansion. (A) Representative expression of CD44 and binding to ESAT-64–17:I-Ab tetramers by CD3+CD4+-gated T cells in the lungs of Mtb (WT)–infected B6 mice on day 21 after infection. As indicated, mice received no T cells or P25 CD4+CD25+ or P25 CD4+CD25neg T cells (105 cells/mouse) intravenously on day 11 after infection. Numerical values represent the percentage of cells binding the tetramer. (B) Cumulative data showing the absolute numbers of ESAT-64–17:I-Ab tetramer–binding cells in the pLNs and lungs at different time points after Mtb infection. Circles represent individual mice and bars represent the mean of each group. (C) Representative expression of CD44 and binding to TB10.44–11:Kb tetramers by CD3+CD8+-gated T cells in the lungs of Mtb (WT)–infected B6 mice on day 17 after infection in the same experiment depicted in A and B. Numerical values represent the percentage of cells binding the tetramer. (D) Cumulative data showing the absolute numbers of TB10.44–11:Kb tetramer–binding cells in the pLNs and lungs at different time points after Mtb infection. Circles represent individual mice and bars represent the mean of each group. The unpaired Student’s t test was performed, and p-values for groups significantly different from the group receiving no T cells are shown. The experiments were performed twice at day 17 and once at other time points.

Similar articles

Cited by

References

    1. Andersen P., Doherty T.M. 2005. The success and failure of BCG - implications for a novel tuberculosis vaccine. Nat. Rev. Microbiol. 3:656–662 10.1038/nrmicro1211 - DOI - PubMed
    1. Antunes I., Tolaini M., Kissenpfennig A., Iwashiro M., Kuribayashi K., Malissen B., Hasenkrug K., Kassiotis G. 2008. Retrovirus-specificity of regulatory T cells is neither present nor required in preventing retrovirus-induced bone marrow immune pathology. Immunity. 29:782–794 10.1016/j.immuni.2008.09.016 - DOI - PMC - PubMed
    1. Ariga H., Shimohakamada Y., Nakada M., Tokunaga T., Kikuchi T., Kariyone A., Tamura T., Takatsu K. 2007. Instruction of naive CD4+ T-cell fate to T-bet expression and T helper 1 development: roles of T-cell receptor-mediated signals. Immunology. 122:210–221 10.1111/j.1365-2567.2007.02630.x - DOI - PMC - PubMed
    1. Bautista J.L., Lio C.W., Lathrop S.K., Forbush K., Liang Y., Luo J., Rudensky A.Y., Hsieh C.S. 2009. Intraclonal competition limits the fate determination of regulatory T cells in the thymus. Nat. Immunol. 10:610–617 10.1038/ni.1739 - DOI - PMC - PubMed
    1. Belkaid Y. 2008. Role of Foxp3-positive regulatory T cells during infection. Eur. J. Immunol. 38:918–921 10.1002/eji.200738120 - DOI - PMC - PubMed

Publication types

MeSH terms