

Scale-free correlations in starling flocks
- PMID: 20547832
- PMCID: PMC2900681
- DOI: 10.1073/pnas.1005766107
Scale-free correlations in starling flocks
Abstract
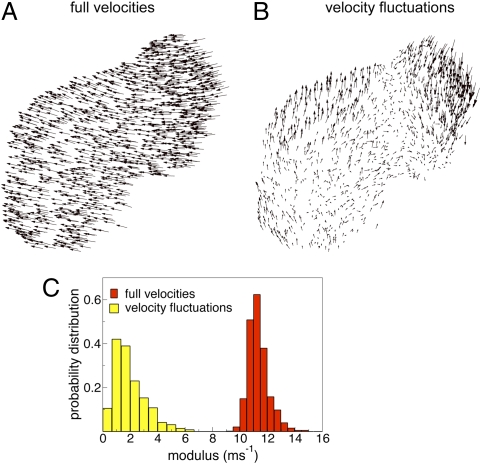
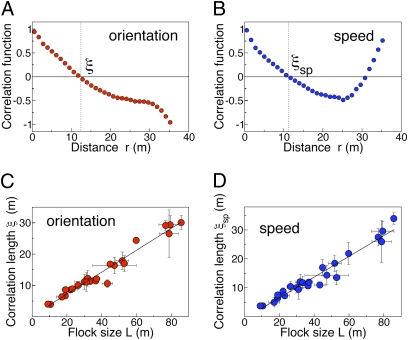
From bird flocks to fish schools, animal groups often seem to react to environmental perturbations as if of one mind. Most studies in collective animal behavior have aimed to understand how a globally ordered state may emerge from simple behavioral rules. Less effort has been devoted to understanding the origin of collective response, namely the way the group as a whole reacts to its environment. Yet, in the presence of strong predatory pressure on the group, collective response may yield a significant adaptive advantage. Here we suggest that collective response in animal groups may be achieved through scale-free behavioral correlations. By reconstructing the 3D position and velocity of individual birds in large flocks of starlings, we measured to what extent the velocity fluctuations of different birds are correlated to each other. We found that the range of such spatial correlation does not have a constant value, but it scales with the linear size of the flock. This result indicates that behavioral correlations are scale free: The change in the behavioral state of one animal affects and is affected by that of all other animals in the group, no matter how large the group is. Scale-free correlations provide each animal with an effective perception range much larger than the direct interindividual interaction range, thus enhancing global response to perturbations. Our results suggest that flocks behave as critical systems, poised to respond maximally to environmental perturbations.
Conflict of interest statement
The authors declare no conflict of interest.
Figures
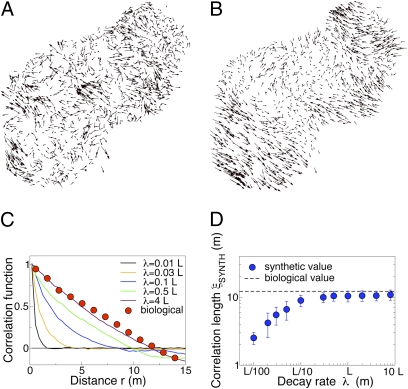
 for various values of the decay length λ. By increasing λ the synthetic correlation function becomes more and more long ranged and it finally becomes very close to the actual biological one in the scale-free regime λ > L. (D) Synthetic correlation length ξSYNTH, as a function of the decay length λ (each point is an average over 50 synthetic samples; errors bars are SDs). As long as λ is smaller than the size of the flock L, ξSYNTH grows following λ. However, in the scale-free regime, λ > L, ξSYNTH saturates to a value very close to the actual biological one.
References
-
- Parrish JK, Hammer WM, editors. Animal Groups in Three Dimensions. Cambridge, UK: Cambridge Univ Press; 1997.
-
- Krause J, Ruxton GD. Living in Groups. Oxford: Oxford Univ Press; 2002.
-
- Couzin ID, Krause J. Self-organization and collective behaviour in vertebrates. Adv Study Behav. 2003;32:1–75.
-
- Okubo A. Dynamical aspects of animal grouping: Swarms, schools, flocks, and herds. Adv Biophys. 1986;22:1–94. - PubMed
-
- Emlen JT. Flocking behaviour in birds. Auk. 1952;69:160–170.
Publication types
MeSH terms
LinkOut - more resources
Full Text Sources
Other Literature Sources
