. 2010 Jun 29;107(26):11811-6.
doi: 10.1073/pnas.1006737107. Epub 2010 Jun 14.

Interference with Sin3 function induces epigenetic reprogramming and differentiation in breast cancer cells

Affiliations

Interference with Sin3 function induces epigenetic reprogramming and differentiation in breast cancer cells

Eduardo F Farias et al. Proc Natl Acad Sci U S A. .

Abstract

Sin3A/B is a master transcriptional scaffold and corepressor that plays an essential role in the regulation of gene transcription and maintenance of chromatin structure, and its inappropriate recruitment has been associated with aberrant gene silencing in cancer. Sin3A/B are highly related, large, multidomian proteins that interact with a wide variety of transcription factors and corepressor components, and we examined whether disruption of the function of a specific domain could lead to epigenetic reprogramming and derepression of specific subsets of genes. To this end, we selected the Sin3A/B-paired amphipathic alpha-helices (PAH2) domain based on its established role in mediating the effects of a relatively small number of transcription factors containing a PAH2-binding motif known as the Sin3 interaction domain (SID). Here, we show that in both human and mouse breast cancer cells, the targeted disruption of Sin3 function by introduction of a SID decoy that interferes with PAH2 binding to SID-containing partner proteins reverted the silencing of genes involved in cell growth and differentiation. In particular, the SID decoy led to epigenetic reprogramming and reexpression of the important breast cancer-associated silenced genes encoding E-cadherin, estrogen receptor alpha, and retinoic acid receptor beta and impaired tumor growth in vivo. Interestingly, the SID decoy was effective in the triple-negative M.D. Anderson-Metastatic Breast-231 (MDA-MB-231) breast cancer cell line, restoring sensitivity to 17beta-estradiol, tamoxifen, and retinoids. Therefore, the development of small molecules that can block interactions between PAH2 and SID-containing proteins offers a targeted epigenetic approach for treating this type of breast cancer that may also have wider therapeutic implications.


Conflict of interest statement

The authors declare no conflict of interest.

Figures

Fig. 1.
Fig. 1.
Expression of a decoy peptide corresponding to MAD SID induces markers of differentiation and contact inhibition in MDA-MB-231 breast cancer cells. (A) Schematic of the SID peptides and expression constructs used in this study. Shown in Upper are the design and sequence of the Tat-SID peptide and Tat-SIDSCR scrambled control. The Tat-SID peptide corresponds to amino acids 5–24 of MAD (indicated in red). This sequence binds Sin3 PAH2 with high affinity (32) and has been previously used to study SID-PAH2 interactions in vitro (33). Peptides contain a leader sequence (YGRKKRRQGGG) corresponding to the HIV type 1 Tat arginine-rich RNA-binding motif (ARM), which has been mutated (RRR > GGG) to improve nuclear entry (34). (B) Morphological changes induced by SID in MDA-MB-231 and MMTV-Myc. The expression of the SID construct induced a cobblestone-like monolayer with well-defined cell–cell contact in contrast to the vector-control transfected cells with a spindle-shape typical of fully transformed epithelial cells. pSID expresses the minimal MAD SID (amino acids 5–20) with N-terminal SV40 nuclear localization signal (NLS) and a triple FLAG epitope. (Scale bar, 100 μm.) (C) Western analysis of expression of the indicated proteins and gene expression in MDA-MB-231 control or expressing SID. (D) Confocal IF analyses showing the reexpression of membrane-associated E-cadherin induced by the expression of SID in MDA-MB-231 cells (green) and MMTV-Myc cells (red). (E) Reexpression of nuclear RARβ in MDA-MB-231 cells detected by immunofluorescence microscopy. (Scale bar, 25 μm.) DAPI staining (blue).
Fig. 2.
Fig. 2.
SID decoy peptide blocks interactions between Sin3 PAH2 and MAD and interferes with recruitment of members of the Sin3 corepressor complex. (A) GST pull-down of MAD by the Sin3A PAH2 domain is blocked by SID peptide. Sin3A PAH2 domain (amino acids 306–450) was expressed in Escherichia coli as a GST fusion and used in a pull-down assay for in vitro interaction with [35S]methionine-labeled MAD (Left) or MAD immunoprecipitated from MDA-MB-231 cell lysates (Right); 25% of input is shown for in vitro-translated MAD and 10% of input for immunoprecipitated MAD (input). Assays were performed using 15 μM Tat-SID or Tat-SIDSCR peptide unless otherwise indicated. (B) Mammalian two-hybrid analysis shows that SID interferes with recruitment of MAD and HDAC1 by Sin3B; 293T cells were transfected with GAL4uasx5-Tk-Luc reporter together with mammalian two-hybrid vectors expressing a fusion of Sin3B with GAL4 DNA binding domain (GAL4DBD) and fusions of MAD and HDAC1 (columns highlighted in green and blue, respectively) with VP16 activation domain (VP16AD), as well as SID expression vectors, as indicated. Samples transfected with a vector expressing mutated SID (pSID2Mut) and pTRE and pCMV-3Tag-1A empty vectors were included as negative controls. Luciferase activity was normalized by cotransfection of Renilla luciferase. The parent GAL4DBD and VP16AD mammalian two-hybrid vectors (pGALO and pNLVP16, repectively) (35), were also used as negative controls. The basal value was set to 1. Values of relative luciferase activity and error bars represent the averages and SDs, respectively, of four separate experiments. Transfection of the pM3-VP16(AD) positive control vector (Clontech), a fusion of GAL4DBD and VP16AD, resulted in a large (60-fold) increase in relative luciferase activity (not shown). Where indicated, samples were treated with 15 μM Tat-SID or Tat-SIDSCR peptide at time of cell plating and after transfection.
Fig. 3.
Fig. 3.
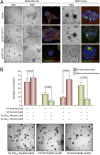
(A) Morphogenesis in 3D cultures in Matrigel. MDA-MB-231 and MMTV-Myc cells expressing SID or the double mutant were cultured in 3D-Matrigel for 14 d. Both vector and the double mutant transfected cells develop large and invasive colonies (Top and Middle); meanwhile, the cells expressing SID were smaller and noninvasive. Moreover, ∼25% of the MDA-MB-231 colonies displayed nonpolarized rudimental lumens (Bottom Right) (L, lumen). However, at 14 d in Matrigel culture, expression patterns of GM130 (red) and caspase-3 (green), polarization and cavitation markers, respectively, did not indicate full polarization of SID-expressing cells. (B) Reversion of the invasive phenotype of the MDA-MB-231 cells in Matrigel 3D cultures. Upper indicates change in numbers of invasive versus noninvasive colonies (as indicated in red- and green-colored bars, respectively) in the presence of different concentrations (as indicated) of cell penetrating SID or SIDSCR (scrambled control) peptide. The colonies were counted after 10 d of treatment with a medium containing fresh peptide changed every 24 h. Lower shows phase-contrast microscopy indicating the effect of each treatment on colony morphology. The reduction in invasive phenotype was quantified by counting five low magnification fields per well done in triplicates (Upper). (Scale bar, 200 μm.) The P value was calculated using unpaired Student t test.
Fig. 4.
Fig. 4.
Expression of the SID domain or the SID-MAD–interacting peptide fused with GFP impairs tumor growth. (A) MMTV-Myc cells (2.5 × 10⁵ cells/fat pad) were injected into the mammary fat pads of FVB syngeneic mice (n = 10). MMTV-Myc cells stably expressing pTHE were injected in the left flank, with vector control injected in the right flank of each mouse as indicated to avoid interanimal variation between groups, and tumors were retrieved after 14 d. (B) Immunohistochemical analysis of the tumors indicates that those expressing the SID domain express higher levels of E-cadherin localized to the plasma membrane (Top Left Inset), higher nuclear expression of p27, and low Rb (8 of 8 tumors studied). (Scale bar, 50 μm.) Similar results were obtained using pEGFP-N3/SID plasmids.
Fig. 5.
Fig. 5.
(A) Schematic representations of the promoters and 5′UTR of CDH1 and ESR1 used in this study. Positions of CpG dinucleotides are indicated by gray ticks, and the transcription initiation sites are represented by black arrows. The relative positions of primer pairs used to PCR-amplify immunoprecipitated DNA from ChIP analysis (green arrows) and bisulfite-modified DNA (red arrows) are also indicated. (B) H3K4me3 levels on the CDH1 and ESR1 promoter regions increase dramatically in response to SID. ChIP analysis was performed with chromatin from wild-type or stably transfected MDA-MB-231 cells as indicated. Cross-linked protein-DNA complexes were immunoprecipitated with an antitrimethyl H3K4 antibody and amplified by real-time PCR. Results are shown as percentage of input DNA. The RPL30 housekeeping gene is shown as a control. (C) Real-time PCR analysis of CDH1 and ESR1 gene expression. Values are shown as molecules per microgram total RNA and were derived from the ΔCt between the GAPDH housekeeping gene and the gene of interest. The amount of GAPDH molecules per microgram total RNA was determined by absolute quantification. (D) The CDH1 and ESR1 promoters undergo demethylation in response to SID. After bisulfite modification of wild-type or stably transfected MDA-MB-231 cells, as indicated, specifically amplified PCR products were sequenced using primers corresponding to the promoter/5′UTR of ESR1. Positions of CpG dinucleotides are indicated by gray ticks, and the transcription initiation sites are indicated by black arrows. Five clones were sequenced per sample, and a black-filled circle represents where a CpG dinucleotide was found to be methylated. Unmethylated CpGs are represented by open circles. CpG positions are shown relative to transcription initiation site. (E) Functional assays for ERα and RAR activation. To determine whether the reexpressed ERα and RARβ were functional in MDA-MB-231 cells transfected with SID (pTHE plasmid), cell proliferation assays were performed. Cells were stimulated with 2.5 nM estradiol (E2) or E2 plus 2.5 μM tamoxifen overnight (Left) or 1 mM ATRA (pan-RAR agonist) or 100 nM AM580 (RARα-specific agonist) daily for 48 h (Right) to determine the activation of ERα and RARs, respectively.

References

    1. Ting AH, McGarvey KM, Baylin SB. The cancer epigenome—components and functional correlates. Genes Dev. 2006;20:3215–3231. - PubMed
    1. Frigola J, et al. Epigenetic remodeling in colorectal cancer results in coordinate gene suppression across an entire chromosome band. Nat Genet. 2006;38:540–549. - PubMed
    1. Fraga MF, et al. Loss of acetylation at Lys16 and trimethylation at Lys20 of histone H4 is a common hallmark of human cancer. Nat Genet. 2005;37:391–400. - PubMed
    1. Silverstein RA, Ekwall K. Sin3: A flexible regulator of global gene expression and genome stability. Curr Genet. 2005;47:1–17. - PubMed
    1. Schreiber-Agus N, et al. An amino-terminal domain of Mxi1 mediates anti-Myc oncogenic activity and interacts with a homolog of the yeast transcriptional repressor SIN3. Cell. 1995;80:777–786. - PubMed

Publication types

MeSH terms