

Lack of lacto/neolacto-glycolipids enhances the formation of glycolipid-enriched microdomains, facilitating B cell activation
- PMID: 20547865
- PMCID: PMC2900644
- DOI: 10.1073/pnas.0914298107
Lack of lacto/neolacto-glycolipids enhances the formation of glycolipid-enriched microdomains, facilitating B cell activation
Abstract
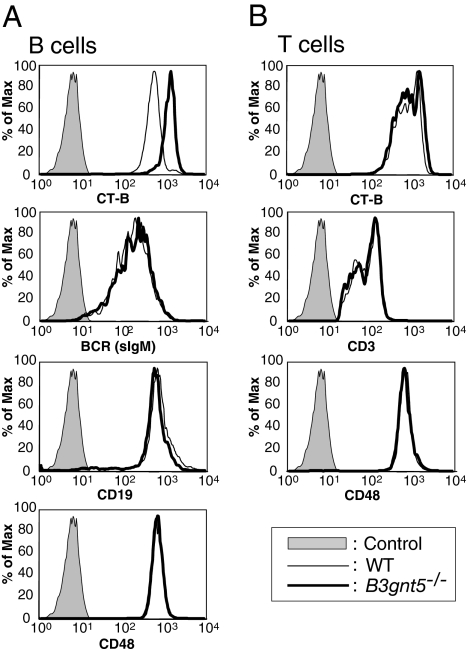
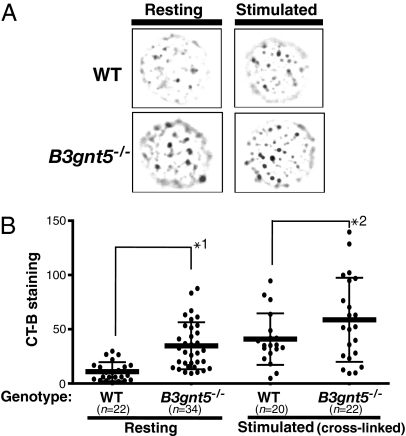
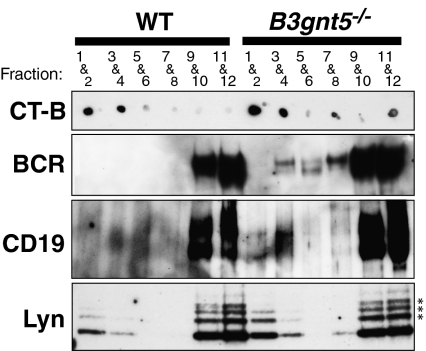
In a previous study, we demonstrated that beta1,3-N-acetylglucosaminyltransferase 5 (B3gnt5) is a lactotriaosylceramide (Lc(3)Cer) synthase that synthesizes a precursor structure for lacto/neolacto-series glycosphingolipids (GSLs) in in vitro experiments. Here, we generated B3gnt5-deficient (B3gnt5(-/-)) mice to investigate the in vivo biological functions of lacto/neolacto-series GSLs. In biochemical analyses, lacto/neolacto-series GSLs were confirmed to be absent and no Lc(3)Cer synthase activity was detected in the tissues of these mice. These results demonstrate that beta3GnT5 is the sole enzyme synthesizing Lc(3)Cer in vivo. Ganglioside GM1, known as a glycosphingolipid-enriched microdomain (GEM) marker, was found to be up-regulated in B3gnt5(-/-) B cells by flow cytometry and fluorescence microscopy. However, no difference in the amount of GM1 was observed by TLC-immunoblotting analysis. The GEM-stained puncta on the surface of B3gnt5(-/-) resting B cells were brighter and larger than those of WT cells. These results suggest that structural alteration of GEM occurs in B3gnt5(-/-) B cells. We next examined whether BCR signaling-related proteins, such as BCR, CD19, and the signaling molecule Lyn, had moved into or out of the GEM fraction. In B3gnt5(-/-) B cells, these molecules were enriched in the GEM fraction or adjacent fraction. Moreover, B3gnt5(-/-) B cells were more sensitive to the induction of intracellular phosphorylation signals on BCR stimulation and proliferated more vigorously than WT B cells. Together, these results suggest that lacto/neolacto-series GSLs play an important role in clustering of GEMs and tether-specific proteins, such as BCR, CD19, and related signaling molecules to the GEMs.
Conflict of interest statement
The authors declare no conflict of interest.
Figures


Similar articles
-
Multiple phenotypic changes in mice after knockout of the B3gnt5 gene, encoding Lc3 synthase--a key enzyme in lacto-neolacto ganglioside synthesis.BMC Dev Biol. 2010 Nov 18;10:114. doi: 10.1186/1471-213X-10-114. BMC Dev Biol. 2010. PMID: 21087515 Free PMC article.
-
Cloning of a mouse beta 1,3 N-acetylglucosaminyltransferase GlcNAc(beta 1,3)Gal(beta 1,4)Glc-ceramide synthase gene encoding the key regulator of lacto-series glycolipid biosynthesis.J Biol Chem. 2001 Aug 10;276(32):30261-9. doi: 10.1074/jbc.M102979200. Epub 2001 May 30. J Biol Chem. 2001. PMID: 11384981
-
The Lc3-synthase gene B3gnt5 is essential to pre-implantation development of the murine embryo.BMC Dev Biol. 2008 Nov 12;8:109. doi: 10.1186/1471-213X-8-109. BMC Dev Biol. 2008. PMID: 19014510 Free PMC article.
-
Multiplicity of Glycosphingolipid-Enriched Microdomain-Driven Immune Signaling.Int J Mol Sci. 2021 Sep 3;22(17):9565. doi: 10.3390/ijms22179565. Int J Mol Sci. 2021. PMID: 34502474 Free PMC article. Review.
-
Membrane microdomains in immunity: glycosphingolipid-enriched domain-mediated innate immune responses.Biofactors. 2012 Jul-Aug;38(4):275-83. doi: 10.1002/biof.1017. Epub 2012 Apr 10. Biofactors. 2012. PMID: 22488955 Review.
Cited by
-
The role of lipid raft aggregation in the infection of type II pneumocytes by Mycobacterium tuberculosis.PLoS One. 2012;7(9):e45028. doi: 10.1371/journal.pone.0045028. Epub 2012 Sep 14. PLoS One. 2012. PMID: 23024786 Free PMC article.
-
Synthesis of a novel photoactivatable glucosylceramide cross-linker.J Lipid Res. 2016 Sep;57(9):1728-36. doi: 10.1194/jlr.D069609. Epub 2016 Jul 13. J Lipid Res. 2016. PMID: 27412675 Free PMC article.
-
Structural characterization of monosialo-, disialo- and trisialo-gangliosides by negative ion AP-MALDI-QIT-TOF mass spectrometry with MS(n) switching.Neurochem Res. 2012 Jun;37(6):1315-24. doi: 10.1007/s11064-012-0735-z. Epub 2012 Mar 6. Neurochem Res. 2012. PMID: 22392257
-
The hypothesis on function of glycosphingolipids and ABO blood groups revisited.Neurochem Res. 2012 Jun;37(6):1170-84. doi: 10.1007/s11064-012-0734-0. Epub 2012 Mar 11. Neurochem Res. 2012. PMID: 22407244 Review.
-
Impacts of β-1, 3-N-acetylglucosaminyltransferases (B3GNTs) in human diseases.Mol Biol Rep. 2024 Mar 29;51(1):476. doi: 10.1007/s11033-024-09405-9. Mol Biol Rep. 2024. PMID: 38553573 Review.
References
-
- Prinetti A, Loberto N, Chigorno V, Sonnino S. Glycosphingolipid behaviour in complex membranes. Biochim Biophys Acta. 2009;1788:184–193. - PubMed
-
- Yohe HC, Coleman DL, Ryan JL. Ganglioside alterations in stimulated murine macrophages. Biochim Biophys Acta. 1985;818:81–86. - PubMed
-
- Simons K, Ikonen E. Functional rafts in cell membranes. Nature. 1997;387:569–572. - PubMed
-
- Brown DA, London E. Structure and function of sphingolipid- and cholesterol-rich membrane rafts. J Biol Chem. 2000;275:17221–17224. - PubMed
-
- Hakomori S. Glycosynapses: Microdomains controlling carbohydrate-dependent cell adhesion and signaling. An Acad Bras Cienc. 2004;76:553–572. - PubMed
Publication types
MeSH terms
Substances
Associated data
- Actions
LinkOut - more resources
Full Text Sources
Molecular Biology Databases
Research Materials
Miscellaneous
