. 2010 Jun 29;107(26):11793-8.
doi: 10.1073/pnas.1002356107. Epub 2010 Jun 14.

Single-molecule spectroscopy of protein folding in a chaperonin cage

Affiliations

Single-molecule spectroscopy of protein folding in a chaperonin cage

Hagen Hofmann et al. Proc Natl Acad Sci U S A. .

Abstract

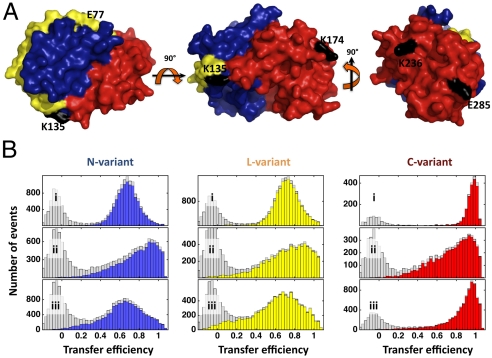
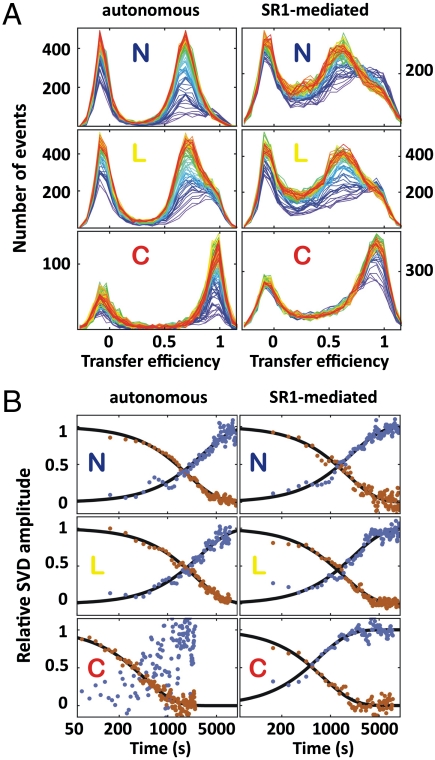
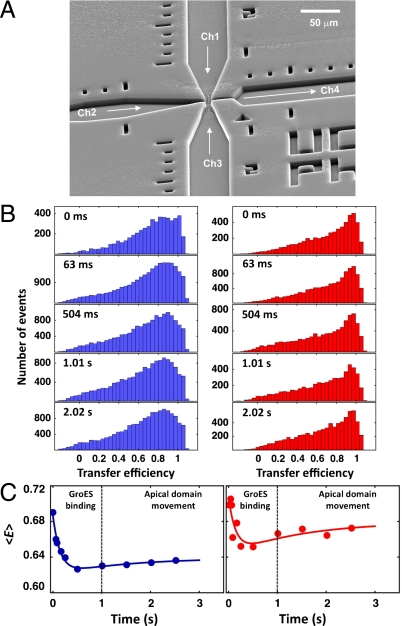
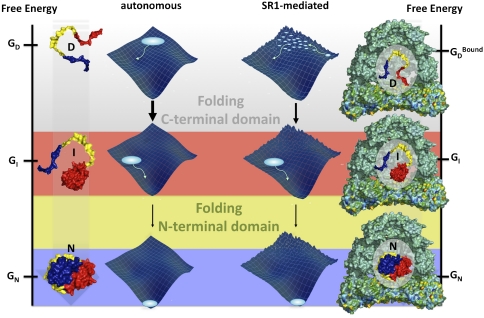
Molecular chaperones are known to be essential for avoiding protein aggregation in vivo, but it is still unclear how they affect protein folding mechanisms. We use single-molecule Förster resonance energy transfer to follow the folding of a protein inside the GroEL/GroES chaperonin cavity over a time range from milliseconds to hours. Our results show that confinement in the chaperonin decelerates the folding of the C-terminal domain in the substrate protein rhodanese, but leaves the folding rate of the N-terminal domain unaffected. Microfluidic mixing experiments indicate that strong interactions of the substrate with the cavity walls impede the folding process, but the folding hierarchy is preserved. Our results imply that no universal chaperonin mechanism exists. Rather, a competition between intra- and intermolecular interactions determines the folding rates and mechanisms of a substrate inside the GroEL/GroES cage.


Conflict of interest statement

The authors declare no conflict of interest.

Figures

Fig. 1.
Fig. 1.
Native structure and transfer efficiency histograms of the rhodanese variants. (A) Surface representation of rhodanese showing the N-terminal domain (blue), the interdomain linker (yellow), and the C-terminal domain (red) (protein data bank entry 1rhs). The rhodanese variants E77C/K135C (N variant), K135C/K174C (L variant), and K236C/E285C (C variant) were labeled with Alexa Fluor 488 as a donor and Alexa Fluor 594 as an acceptor. Label attachment sites are indicated in black. (B) Transfer efficiency histograms of native rhodanese (i), the SR1-rhodanese complex (ii), and the SR1-rhodanese complex 1.5 h after addition of GroES and ATP (iii). The gray histograms were recorded with donor excitation only; the colored histograms were recorded using dual color excitation of donor and acceptor (35, 73) to eliminate the contribution close to E = 0 from molecules lacking an active acceptor dye.
Fig. 2.
Fig. 2.
Kinetic analysis of the autonomous and chaperone-mediated rhodanese refolding reactions using SVD. (A) Transfer efficiency histograms as a function of time (progressing from blue to red) of the autonomous (Left) and SR1-mediated (Right) folding reaction for N variant, L variant, and C variant (from Top to Bottom) at 24 °C. (B) Kinetics from the first (red) and second (blue) amplitude vectors of the SVD for the autonomous (Left) and SR1-mediated (Right) folding reaction of the N variant, L variant, and C variant.
Fig. 3.
Fig. 3.
Examples of basis vectors from multidimensional SVD for the autonomous and SR1-mediated folding reactions of the L variant. (A, B) Time evolution (progressing from blue to red) of the first (Left) and second (Right) one-dimensional-basis vectors for the autonomous (A) and SR1-mediated folding (B) of the L variant. Note that the one-dimensional-basis vectors shown here are just one possible projection of the multidimensional basis vectors on the transfer efficiency dimension to illustrate the kinetics. (C, D) Examples of two-dimensional-basis vectors from multidimensional SVD for the autonomous (C) and SR1-mediated (D) folding reactions of the L variant (from Top to Bottom: donor and acceptor fluorescence lifetime, donor fluorescence anisotropy, duration of bursts). The color code indicates the absolute SVD amplitude (see color scale). The basis vectors indicate the positions of changes of the corresponding observables in the histograms and are ordered according to their singular values.
Fig. 4.
Fig. 4.
Effect of temperature and solvent entropy on the autonomous and SR1-mediated folding reactions. (A) Arrhenius plots for the autonomous (Circles) and SR1-mediated (Triangles) folding reaction for the N variant (Left), L variant (Center), and C variant (Right). Solid (autonomous) and dashed (SR1-mediated) lines are Arrhenius fits according to Eq. 1. Error bars indicate standard deviations estimated from the two SVD-components or from two or three independent measurements for the cases where several measurements were available. The resulting activation enthalpies ΔH are (96 ± 7) kJ mol-1 (autonomous) and (88 ± 8) kJ mol-1 (SR1-mediated) for the N variant, (100 ± 25) kJ mol-1 (autonomous) and (100 ± 17) kJ mol-1 (SR1-mediated) for the L variant, and (161 ± 5) kJ mol-1 (autonomous) and (123 ± 7) kJ mol-1 (SR1-mediated) for the C variant. (B) Kinetic solvent isotope effects shown by the dependence of the ratio k/kH on the volume fraction of D2O at 27 °C for the autonomous (Top) and SR1-mediated (Bottom) refolding rates of the N variant (cyan) and C variant (red). Error bars indicate standard deviations estimated from at least two independent measurements, and lines represent linear regressions to illustrate the trends.
Fig. 5.
Fig. 5.
Rapid processes in SR1-mediated rhodanese folding investigated with microfluidic mixing. (A) Scanning electron micrograph of the microfluidic mixing device (46). SR1-bound rhodanese in Ch2 is mixed with GroES and ATP in Ch1 and Ch3 in the narrow mixing region. Measurements were taken at different positions along the observation channel Ch4, corresponding to different times after mixing. (B) Transfer efficiency histograms of SR1-bound N variant (Left) and C variant (Right) at different times after mixing GroEL-bound rhodanese with 2 μM GroES and 2 mM ATP. (C) Kinetics of the average transfer efficiency 〈E〉 for the SR1-bound N variant (Left) and C variant (Right) obtained from the histograms in B. The lines represent a global double exponential fit to the data. The rate constant describing the slow increase after the initial drop was constrained to the rate constant of the apical domain movement of 0.68 s-1 (48). The histograms were recorded using dual excitation of donor and acceptor (35, 73) to eliminate the contribution close to E = 0 from molecules lacking an active acceptor dye.
Fig. 6.
Fig. 6.
Schematic of the autonomous and SR1-mediated folding of rhodanese. Rhodanese folds via a partially folded intermediate, in which the C-terminal domain (red) is already folded (Left). In the chaperonin-mediated reaction, molecular friction (energetic roughness) from interactions with the cavity wall decelerates the folding of the C-terminal domain. However, the folding pathway of rhodanese is preserved (Right).

Similar articles

Cited by

References

    1. Thirumalai D, Lorimer GH. Chaperonin-mediated protein folding. Annu Rev Biophys Biomol Struct. 2001;30:245–269. - PubMed
    1. Hartl FU, Hayer-Hartl M. Protein folding—Molecular chaperones in the cytosol: from nascent chain to folded protein. Science. 2002;295:1852–1858. - PubMed
    1. Bukau B, Weissman J, Horwich A. Molecular chaperones and protein quality control. Cell. 2006;125:443–451. - PubMed
    1. Ellgaard L, Helenius A. Quality control in the endoplasmic reticulum. Nat Rev Mol Cell Biol. 2003;4:181–191. - PubMed
    1. Fersht AR. Structure and mechanism in protein science. New York: W.H. Freeman and Company; 1998.

Publication types

MeSH terms