. 2010 Sep;59(9):2271-80.
doi: 10.2337/db10-0401. Epub 2010 Jun 14.

Brain insulin action regulates hypothalamic glucose sensing and the counterregulatory response to hypoglycemia

Affiliations

Brain insulin action regulates hypothalamic glucose sensing and the counterregulatory response to hypoglycemia

Kelly A Diggs-Andrews et al. Diabetes. 2010 Sep.

Abstract

Objective: An impaired ability to sense and appropriately respond to insulin-induced hypoglycemia is a common and serious complication faced by insulin-treated diabetic patients. This study tests the hypothesis that insulin acts directly in the brain to regulate critical glucose-sensing neurons in the hypothalamus to mediate the counterregulatory response to hypoglycemia.

Research design and methods: To delineate insulin actions in the brain, neuron-specific insulin receptor knockout (NIRKO) mice and littermate controls were subjected to graded hypoglycemic (100, 70, 50, and 30 mg/dl) hyperinsulinemic (20 mU/kg/min) clamps and nonhypoglycemic stressors (e.g., restraint, heat). Subsequently, counterregulatory responses, hypothalamic neuronal activation (with transcriptional marker c-fos), and regional brain glucose uptake (via (14)C-2deoxyglucose autoradiography) were measured. Additionally, electrophysiological activity of individual glucose-inhibited neurons and hypothalamic glucose sensing protein expression (GLUTs, glucokinase) were measured.

Results: NIRKO mice revealed a glycemia-dependent impairment in the sympathoadrenal response to hypoglycemia and demonstrated markedly reduced (3-fold) hypothalamic c-fos activation in response to hypoglycemia but not other stressors. Glucose-inhibited neurons in the ventromedial hypothalamus of NIRKO mice displayed significantly blunted glucose responsiveness (membrane potential and input resistance responses were blunted 66 and 80%, respectively). Further, hypothalamic expression of the insulin-responsive GLUT 4, but not glucokinase, was reduced by 30% in NIRKO mice while regional brain glucose uptake remained unaltered.

Conclusions: Chronically, insulin acts in the brain to regulate the counterregulatory response to hypoglycemia by directly altering glucose sensing in hypothalamic neurons and shifting the glycemic levels necessary to elicit a normal sympathoadrenal response.


Figures

FIG. 1.
FIG. 1.
Hyperinsulinemic, graded hypoglycemic clamps. Blood glucose levels are shown for NIRKO (filled circles) and control (open circles) mice (n = 6–8 mice per group). After basal sampling, insulin was infused (20 mU/kg/min) and blood glucose levels were measured at 10-min intervals via arterial sampling. By adjusting the rate of intravenous glucose infusion, glucose levels were carefully lowered, then clamped at matched, predetermined glycemic levels (110, 70, 50, and 30 mg/dl) to create different degrees of hypoglycemic stress (none, mild, moderate, and severe, respectively).
FIG. 2.
FIG. 2.
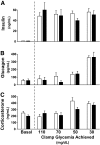
Hormone levels during graded hyperinsulinemic glucose clamps. Results are shown for NIRKO (closed bars) and control (open bars) mice (n = 6–8 mice per group). A: By experimental design, insulin levels rose markedly and similarly between groups during the hyperinsulinemic clamps. B and C: Glucagon (B) and corticosterone (C) levels in both treatment groups rose significantly above basal levels (P < 0.05) during moderate and severe hypoglycemia but similarly between treatment groups.
FIG. 3.
FIG. 3.
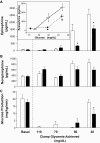
Catecholamine and hepatic glucose production levels in a series of hyperinsulinemic glucose clamps. Results are shown for NIRKO (closed bars) and control (open bars) mice (n = 6–8 mice per group). A: The epinephrine response was significantly impaired in NIRKO mice (P < 0.05) during moderate (50 mg/dl) and severe (30 mg/dl) hypoglycemia. The inset picture demonstrates a shift in the hypoglycemia dose–response curve by the solid (controls) versus dashed (NIRKO) lines. B: Norepinephrine levels in both treatment groups rose significantly higher from the basal period during moderate and severe hypoglycemia, but there was no difference between NIRKO and control responses. C: Hepatic glucose production, in the basal period prior to insulin infusion, was the same in control and NIRKO mice. During the hyperinsulinemic glucose clamps at mild and moderate hypoglycemia, HGP was suppressed. Despite the hyperinsulinemia, during severe hypoglycemia (30 mg/dl), hepatic glucose production rose significantly but remained lower in NIRKO as compared with control mice. *P < 0.05.
FIG. 4.
FIG. 4.
Blunted neuronal activation and glucose responsiveness in NIRKO glucose-sensing neurons. A: After a 2-h hypoglycemic insult, neuronal activity was assessed using the marker c-fos. Representative images of matched hypothalamic sections highlighting c-fos staining in the PVN in NIRKO (right image) and littermate controls (left image). B: The quantity of c-fos positive cells located within the PVN was minimally induced in both groups during euglycemia (n = 4 mice per group). During matched hypoglycemia, the number of c-fos positive cells was significantly less in NIRKO (n = 4, closed bars) as compared with littermate control (n = 6, open bars) mice. C and D: Individual glucose-inhibited neurons were identified as those neurons that increased their action potential frequency, membrane potential, and input resistance with decreases in extracellular glucose from 2.5 to 0.1 mmol/l glucose. In response to lowering extracellular glucose levels from 2.5 to 0.5 mmol/l glucose (G), the percentage change in membrane potential (C) and input resistance (D) of glucose-inhibited neurons was significantly lower in NIRKO (n = 7, closed bars) compared with littermate controls (n = 6, open bars). *P < 0.05, **P < 0.01. (A high-quality color representation of this figure is available in the online issue.)
FIG. 5.
FIG. 5.
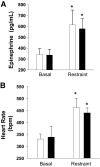
NIRKO mice have a normal physiological response to restraint stress. NIRKO (n = 6, closed bars) and littermate control (n = 6, open bars) mice were placed into a confining restraint device for 45 min. A and B: Plasma epinephrine levels (A) and heart rates (B) were elevated in response to restraint stress, but equally in control and NIRKO mice. *P < 0.05 vs. basal.
FIG. 6.
FIG. 6.
NIRKO mice display normal physiological responses to heat stress. NIRKO (n = 6, closed bars) and littermate controls (n = 6, open bars) were subjected to heat stress for 90 min. A and B: Plasma epinephrine (A) and norepinephrine (B) levels were not significantly different between NIRKO and control mice. C: Representative images of matched hypothalamic sections highlighting heat stress induced c-fos staining in the PVN. D: The quantity of c-fos positive cells was similar between NIRKO and controls. (A high-quality color representation of this figure is available in the online issue.)
FIG. 7.
FIG. 7.
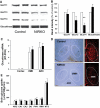
GLUT 4, not GLUT1, GLUT3, or glucokinase expression, is reduced in NIRKO brains. A and B: Western blots of whole hypothalamic extracts from NIRKO and littermate controls (n = 5–6 mice per group) were performed. Representative images (A) and graph (B) quantifying protein expression of glucose transporters (GLUT1, GLUT3, and GLUT4) and glucokinase are shown. C: Although glucokinase mRNA was highly expressed in the VMH and ARC as compared with the cortex, there was no difference between NIRKO (n = 7, closed bars) and controls (n = 8, open bars). D: Regional localization of GLUT4 protein content, as determined by hypothalamic DAB staining (left) and immunofluorescence (right) of control (above) and NIRKO (below) mice, shows enriched GLUT4 protein content in the VMH (circled) and ARC (triangle) of control mice. GLUT4 protein content was 62 ± 6% lower in NIRKO mice. E: Regional brain glucose uptake was quantified using 14C 2-deoxyglucose during a hyperinsulinemic-hypoglycemic (∼30 mg/dl) clamp. Results show that regional brain glucose uptake in all regions measured [hippocampus (CA1, CA3, DG), hypothalamus (VMH, ARC, PVN), and hindbrain (NTS)] are similar among NIRKO (n = 6, closed bars) and controls (n = 9, open bars). (A high-quality digital representation of this figure is available in the online issue.)

Comment in

References

    1. Epidemiology of severe hypoglycemia in the diabetes control and complications trial. The DCCT Research Group. Am J Med 1991;90:450–459 - PubMed
    1. Intensive blood-glucose control with sulphonylureas or insulin compared with conventional treatment and risk of complications in patients with type 2 diabetes (UKPDS 33). UK Prospective Diabetes Study (UKPDS) Group. Lancet 1998;352:837–853 - PubMed
    1. Laing SP, Swerdlow AJ, Slater SD, Botha JL, Burden AC, Waugh NR, Smith AW, Hill RD, Bingley PJ, Patterson CC, Qiao Z, Keen H. The British Diabetic Association Cohort Study, II. cause-specific mortality in patients with insulin-treated diabetes mellitus. Diabet Med 1999;16:466–471 - PubMed
    1. Cryer PE, Davis SN, Shamoon H. Hypoglycemia in diabetes. Diabetes Care 2003;26:1902–1912 - PubMed
    1. Jones TW, Davis EA. Hypoglycemia in children with type 1 diabetes: current issues and controversies. Pediatr Diabetes 2003;4:143–150 - PubMed

Publication types

MeSH terms