. 2010 Sep;59(9):2107-16.
doi: 10.2337/db10-0148. Epub 2010 Jun 14.

Ablation of 4E-BP1/2 prevents hyperglycemia-mediated induction of VEGF expression in the rodent retina and in Muller cells in culture

Affiliations

Ablation of 4E-BP1/2 prevents hyperglycemia-mediated induction of VEGF expression in the rodent retina and in Muller cells in culture

Tabitha L Schrufer et al. Diabetes. 2010 Sep.

Abstract

Objective: Vascular endothelial growth factor (VEGF) contributes to diabetic retinopathy, but control of its expression is not well understood. Here, we tested the hypothesis that hyperglycemia mediates induction of VEGF expression in a eukaryotic initiation factor 4E (eIF4E) binding protein (4E-BP) 1 and 2 dependent manner.

Research design and methods: The retina was harvested from control and type 1 diabetic rats and mice and analyzed for VEGF mRNA and protein expression as well as biomarkers of translational control mechanisms. Similar analyses were performed in Müller cell cultures exposed to hyperglycemic conditions. The effect of 4E-BP1 and 4E-BP2 gene deletion on VEGF expression was examined in mice and in mouse embryo fibroblasts (MEFs).

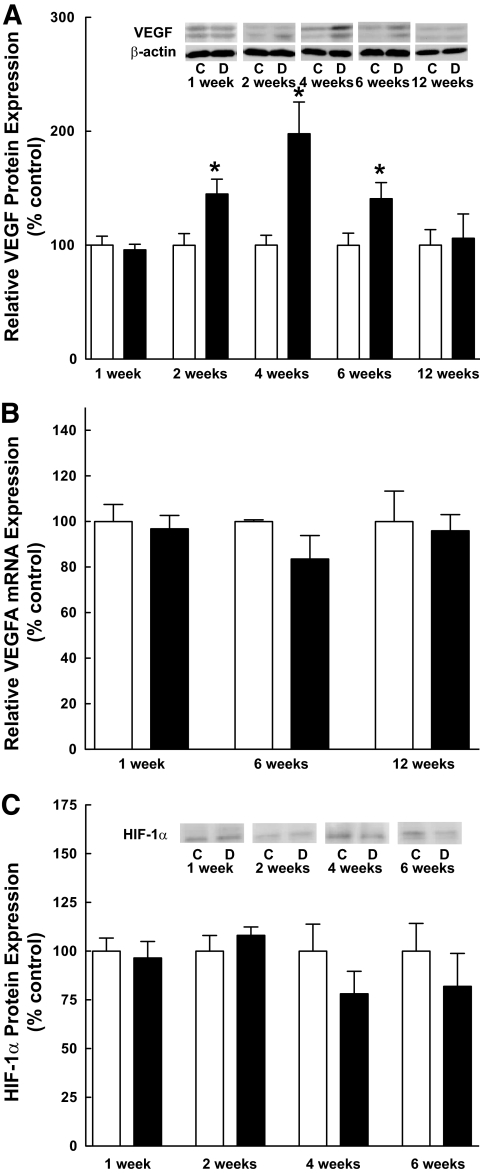
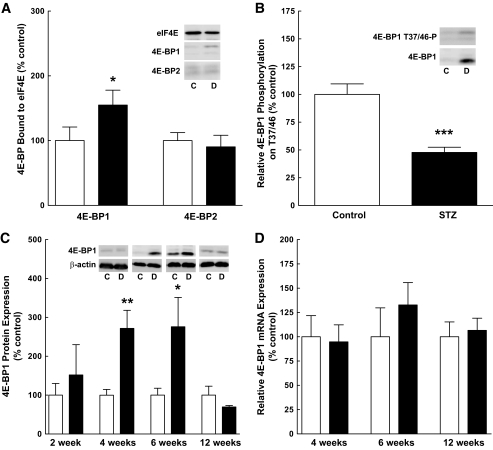
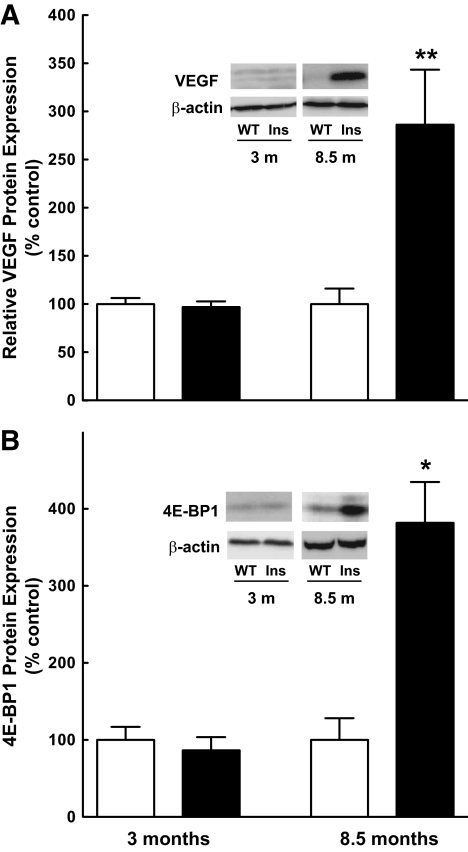
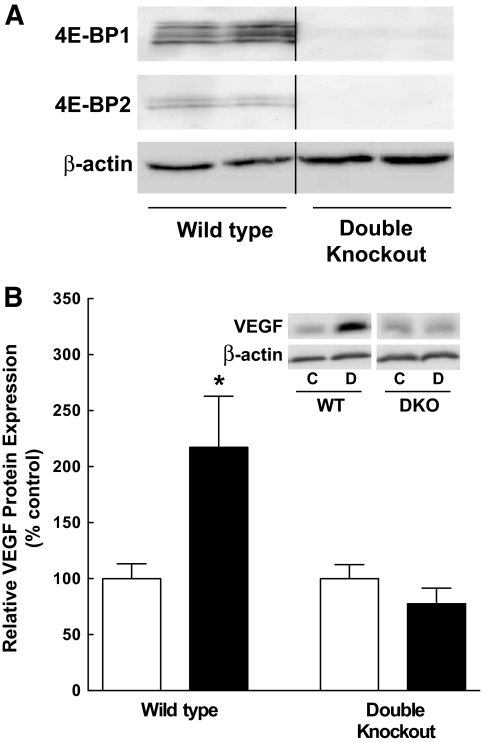
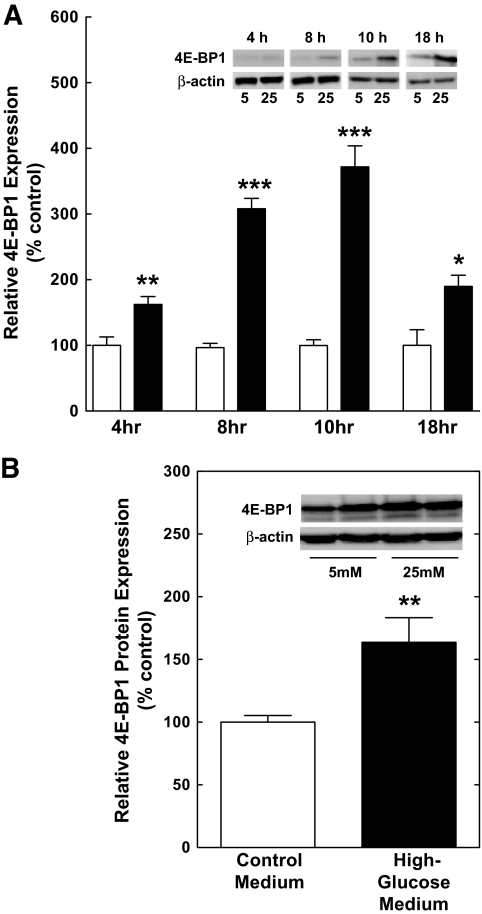
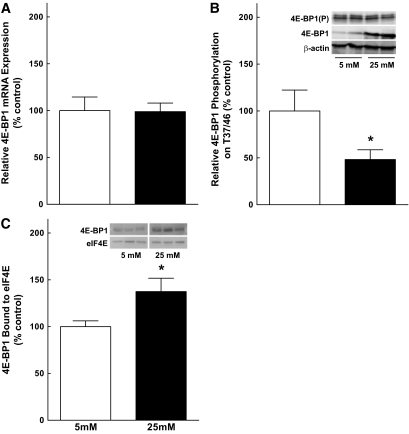
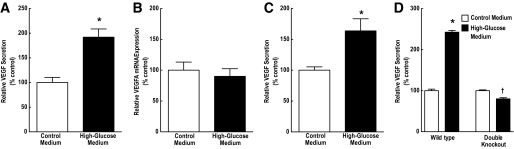
Results: Whereas VEGF mRNA in the retina remained constant, VEGF expression was increased as early as 2 weeks after the onset of diabetes. Increases in expression of 4E-BP1 protein mirrored those of VEGF and expression of 4E-BP1 mRNA was unchanged. Similar results were observed after 10 h of exposure of cells in culture to hyperglycemic conditions. Importantly, the diabetes-induced increase in VEGF expression was not observed in mice deficient in 4E-BP1 and 4E-BP2, nor in MEFs lacking the two proteins.

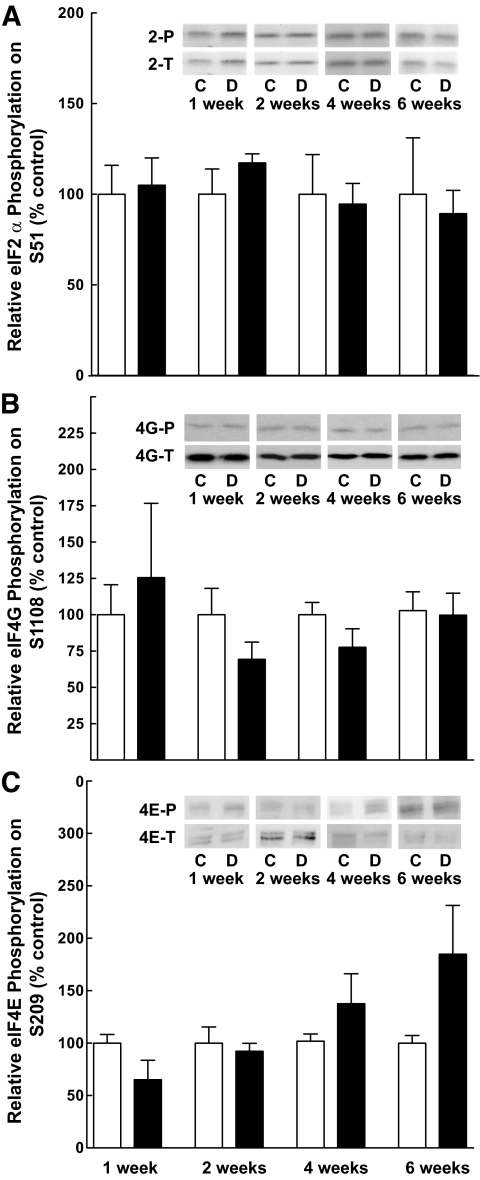
Conclusions: Hyperglycemia induces VEGF expression through cap-independent mRNA translation mediated by increased expression of 4E-BP1. Because the VEGF mRNA contains two internal ribosome entry sites, the increased expression is likely a consequence of ribosome loading at these sites. These findings provide new insights into potential targets for treatment of diabetic retinopathy.


Figures

FIG. 1.
FIG. 1.
VEGF expression is increased in the retina of diabetic rats in the absence of changes in VEGF mRNA. A: Western blot analysis of VEGF expression. VEGF expression was analyzed in retinal samples from 13 control and 14 diabetic rats at 1 week, 12 control and 14 diabetic rats at 2 weeks, 12 control and 12 diabetic rats at 4 weeks, 13 control and 13 diabetic rats at 6 weeks, and 5 control and 7 diabetic rats at 12 weeks as described in research design and methods. The antibody used in these studies recognizes the 121, 165, and 189 splice variants of VEGF. The molecular weights of the two bands detected by Western blot correspond to the 165 and 189 splice variants. VEGF-A binds to both the VEGF receptor 1 (VEGFR1) and VEGFR2. Activation of the receptors leads to increased vascular permeability and upregulated angiogenesis. Values represent the mean expressed as a percentage of the control value ± SEM; control (white bars) and diabetic (black bars) animals. B: Quantitative RT-PCR of VEGF mRNA. Total RNA was extracted from the retina of 6 control and 9 diabetic rats at 4 weeks, 3 control and 6 diabetic rats at 6 weeks, and 10 control and 10 diabetic rats at 12 weeks as described under research design and methods. Values represent the mean expressed as a percentage of an internal β-actin control ± SEM. C: Western blot analysis of HIF-1α protein expression. HIF-1α protein expression was analyzed in retinal samples from 5–6 control and 4–5 diabetic rats at each time point as described in research design and methods. Values represent the mean expressed as a percentage of the control value ± SEM. *P < 0.05 versus corresponding control value.
FIG. 2.
FIG. 2.
The relative phosphorylation of a number of biomarkers of mRNA translational control is unchanged in the retina after induction of diabetes. Samples from retinal homogenates prepared as described in research design and methods were assessed for the relative phosphorylation of (A) eIF2α on Ser51, (B) eIF4G on Ser1108, and (C) eIF4E on Ser209. Values for phosphorylation status were normalized to the amount of the respective total protein. Values represent the mean ± SEM of at least three independent sets of animals at each time point (n = 2–4 within each set), except that the control value for eIF2α at 6 weeks represents two animals. Control (white bars) and diabetic (black bars) animals.
FIG. 3.
FIG. 3.
Enhanced association of 4E-BP1 with eIF4E in the retina of diabetic rats is a result of decreased phosphorylation and increased expression of 4E-BP1. A: eIF4E immunoprecipitation. eIF4E immunoprecipitation was carried out as described in research design and methods. Twenty μL of sample was loaded per well. The amount of 4E-BP1 and 4E-BP2 present in the immunoprecipitate was normalized to eIF4E and displayed as a percentage of the control mean ± SEM (n = 8); control (white bars) and diabetic (black bars) animals. B: Western blot analysis of 4E-BP1 phosphorylation. 4E-BP1 phosphorylation on T37/46 was normalized to total 4E-BP1 measured from 12 control and 12 diabetic rat retinal extracts 4 weeks after the induction of diabetes; values are displayed as a percentage of the control mean ± SEM. C: Western blot analysis of 4E-BP1 expression. Sixty μg of protein was loaded per lane. Representative blots are shown. D: Quantitative RT-PCR of 4E-BP1 mRNA. Retinal RNA was extracted as described in research design and methods from 6 control and 9 diabetic rats at 4 weeks, 3 control and 6 diabetic rats at 6 weeks, and 10 control and 10 diabetic rats at 12 weeks. Values represent the mean expressed as a percentage of internal β-actin control ± SEM. *P < 0.05, **P < 0.01, ***P < 0.001 versus corresponding control value.
FIG. 4.
FIG. 4.
VEGF expression increases concomitantly with 4E-BP1 expression in Ins2Akita diabetic mice. A: Western blot analysis of VEGF expression. Sixty μg of protein was loaded per lane. Values represent the mean expressed as a percentage of control samples ± SEM. Data are representative of retinas from seven wild-type (WT) and four Ins2Akita diabetic (Ins) mice at 3 months, and three WT and three Ins2Akita diabetic mice at 8.5 months of age; control (white bars) and diabetic (black bars) animals. B: Western blot analysis of 4E-BP1 expression in Lambda phosphatase-treated retinal extracts. Sixty μg of protein was loaded per lane. *P < 0.01, **P < 0.001 versus corresponding control value.
FIG. 5.
FIG. 5.
Ablation of 4E-BP1/2 in mice attenuates the diabetes-induced increase in VEGF expression. A: Western blot analysis of 4E-BP1/2 protein expression in the retina of wild-type (WT) and Eif4ebp1;Eif4ebp2 double knockout (DKO) control mice. Four-week-old mice were injected with STZ as described in research design and methods, and 5 weeks later protein (60 μg) was analyzed from six WT and six DKO mice. Representative blots are shown. All samples were run on the same gel, but not in contiguous lanes. B: Western blot analysis of VEGF expression in the retina of WT and DKO control and diabetic mice. Protein (60 μg) was analyzed from 12 control and 12 diabetic wild-type mice, and 7 control and 8 diabetic DKO mice; control (white bars) and diabetic (black bars) animals. Values represent the mean ± SEM. *P < 0.05 versus corresponding control value.
FIG. 6.
FIG. 6.
4E-BP1 expression is increased under hyperglycemic conditions. A: TR-MUL cells were exposed to either control medium (white bars) or high-glucose medium (black bars), and cells were harvested at the indicated time points. Lysates containing 30 μg of protein were subjected to Lambda phosphatase treatment and then subjected to Western blot analysis for 4E-BP1 protein quantitation. Values represent the mean expressed as a percentage of the control ± SEM of 8 or 6 dishes of cells incubated in control or high-glucose medium for 4 h, respectively, 8 or 6 dishes of cells incubated in control or high-glucose medium for 8 h, respectively, 21 or 19 dishes of cells incubated in control or high-glucose medium for 10 h, respectively, 6 or 6 dishes of cells incubated in control or high-glucose medium for 18 h, respectively. B: MIO-M1 cells were incubated in control or high-glucose medium, and cells were harvested 10 h later. Cell lysates containing 30 μg of protein were subjected to Lambda phosphatase treatment and then analyzed by Western blot analysis for 4E-BP1. Values represent the mean expressed as a percentage of the control ± SEM of 8 and 6 dishes of cells incubated in control or high-glucose medium, respectively. *P < 0.05, **P < 0.01, ***P < 0.001 versus corresponding control value.
FIG. 7.
FIG. 7.
Relative phosphorylation of 4E-BP1 on T37/46 is reduced under hyperglycemic conditions, leading to enhanced association with eIF4E. A: Quantitative RT-PCR of 4E-BP1 mRNA. TR-MUL cells were exposed to control medium (white bar) or high-glucose medium (black bar) for 10 h followed by RNA extraction as described in research design and methods. Values represent the mean of 4E-BP1 mRNA expression normalized to an internal β-actin control and are expressed as a percentage of control ± SEM of 5 or 6 dishes of cells per condition. B: Western blot analysis of 4E-BP1 phosphorylation on T37/46. MIO-M1 cells were exposed to control or high-glucose medium and 30 μg of protein were subjected to Western blot analysis for 4E-BP1 T37/46 phosphorylation. Values represent the mean expressed as a percentage of the control ± SEM of 5 or 6 dishes of cells per condition. C: Analysis of 4E-BP1:eIF4E association. Lysates from eIF4E immunoprecipitates were subjected to Western blot analysis for the coimmunoprecipitation of 4E-BP1 from cells exposed to control or high-glucose medium. Values represent the mean expressed as a percentage of the control ± SEM of 6 dishes of cells per condition. Representative blots are shown as an inset. *P < 0.05 versus corresponding control value.
FIG. 8.
FIG. 8.
Hyperglycemic conditions stimulate secretion of VEGF in retinal Müller cells, but not in Eif4ebp1;Eif4ebp2 double knockout (DKO) MEFs. A: Analysis of VEGF secretion. Medium was collected from TR-MUL cells exposed to control medium (white bar) or high-glucose medium (black bar) and subjected to ELISA analysis of VEGFA concentration. VEGF was normalized to protein content in the cell lysates. Values represent the mean expressed as a percentage of the control ± SEM of 6 dishes of cells per condition. B: Quantitative RT-PCR of VEGF mRNA. RNA was extracted from TR-MUL cells exposed to control or high-glucose medium followed by RNA isolation as described in research design and methods. Values represent the mean of 4E-BP1 mRNA expression normalized to an internal β-actin mRNA control and are expressed as a percentage of control ± SEM of 6 dishes of cells per condition. C: Analysis of VEGF secretion in the human Müller cell line, MIO-M1. Medium was collected from TR-MUL cells exposed to control or high-glucose medium and subjected to ELISA for measurement of VEGFA concentration as described above. Values represent the mean expressed as a percentage of the control ± SEM of 6 dishes of cells per condition. D: Analysis of VEGF secretion. Medium was collected from Eif4ebp1;Eif4ebp2 WT and DKO MEFs exposed to control or high-glucose medium and subjected to ELISA for VEGFA concentration. Values represent the mean expressed as a percentage of the control ± SEM of 9 dishes of cells of WT cells per condition and 6 dishes of double-knockout cells per condition. *P < 0.001, †P < 0.01 when compared with DKO cells maintained in control medium.

Similar articles

Cited by

References

    1. Saaddine JB, Honeycutt AA, Narayan KM, Zhang X, Klein R, Boyle JP. Projection of diabetic retinopathy and other major eye diseases among people with diabetes mellitus: United States, 2005–2050. Arch Ophthalmol 2008;126:1740–1747 - PubMed
    1. Adamis AP, Miller JW, Bernal MT, D'Amico DJ, Folkman J, Yeo TK, Yeo KT. Increased vascular endothelial growth factor levels in the vitreous of eyes with proliferative diabetic retinopathy. Am J Ophthalmol 1994;118:445–450 - PubMed
    1. Aiello LM, Cavallerano J. Diabetic retinopathy. Curr Ther Endocrinol Metab 1994;5:436–446 - PubMed
    1. Aiello LP, Avery RL, Arrigg PG, Keyt BA, Jampel HD, Shah ST, Pasquale LR, Thieme H, Iwamoto MA, Park JE. Vascular endothelial growth factor in ocular fluid of patients with diabetic retinopathy and other retinal disorders. N Engl J Med 1994;331:1480–1487 - PubMed
    1. Miller JW, Adamis AP, Shima DT, D'Amore PA, Moulton RS, O'Reilly MS, Folkman J, Dvorak HF, Brown LF, Berse B. Vascular endothelial growth factor/vascular permeability factor is temporally and spatially correlated with ocular angiogenesis in a primate model. Am J Pathol 1994;145:574–584 - PMC - PubMed

Publication types

MeSH terms

Substances