. 2010 Sep;59(9):2198-208.
doi: 10.2337/db09-1505. Epub 2010 Jun 14.

Membrane potential-dependent inactivation of voltage-gated ion channels in alpha-cells inhibits glucagon secretion from human islets

Affiliations

Membrane potential-dependent inactivation of voltage-gated ion channels in alpha-cells inhibits glucagon secretion from human islets

Reshma Ramracheya et al. Diabetes. 2010 Sep.

Abstract

Objective: To document the properties of the voltage-gated ion channels in human pancreatic alpha-cells and their role in glucagon release.

Research design and methods: Glucagon release was measured from intact islets. [Ca(2+)](i) was recorded in cells showing spontaneous activity at 1 mmol/l glucose. Membrane currents and potential were measured by whole-cell patch-clamping in isolated alpha-cells identified by immunocytochemistry.

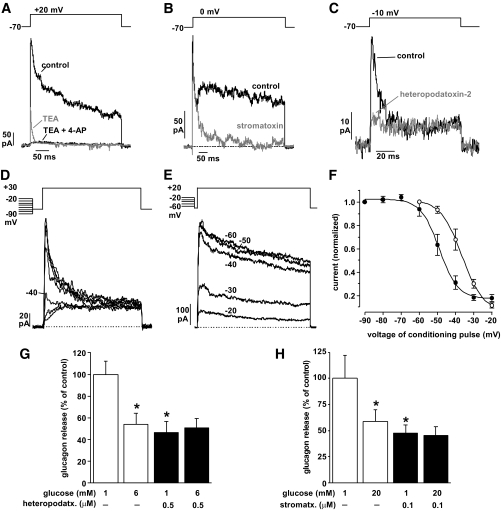
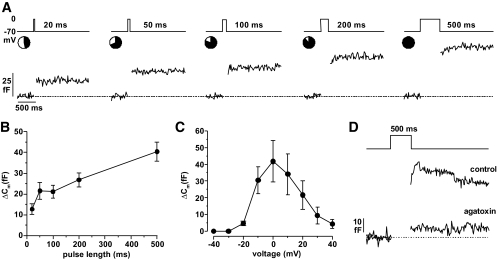
Result: Glucose inhibited glucagon secretion from human islets; maximal inhibition was observed at 6 mmol/l glucose. Glucagon secretion at 1 mmol/l glucose was inhibited by insulin but not by ZnCl(2). Glucose remained inhibitory in the presence of ZnCl(2) and after blockade of type-2 somatostatin receptors. Human alpha-cells are electrically active at 1 mmol/l glucose. Inhibition of K(ATP)-channels with tolbutamide depolarized alpha-cells by 10 mV and reduced the action potential amplitude. Human alpha-cells contain heteropodatoxin-sensitive A-type K(+)-channels, stromatoxin-sensitive delayed rectifying K(+)-channels, tetrodotoxin-sensitive Na(+)-currents, and low-threshold T-type, isradipine-sensitive L-type, and omega-agatoxin-sensitive P/Q-type Ca(2+)-channels. Glucagon secretion at 1 mmol/l glucose was inhibited by 40-70% by tetrodotoxin, heteropodatoxin-2, stromatoxin, omega-agatoxin, and isradipine. The [Ca(2+)](i) oscillations depend principally on Ca(2+)-influx via L-type Ca(2+)-channels. Capacitance measurements revealed a rapid (<50 ms) component of exocytosis. Exocytosis was negligible at voltages below -20 mV and peaked at 0 mV. Blocking P/Q-type Ca(2+)-currents abolished depolarization-evoked exocytosis.

Conclusions: Human alpha-cells are electrically excitable, and blockade of any ion channel involved in action potential depolarization or repolarization results in inhibition of glucagon secretion. We propose that voltage-dependent inactivation of these channels underlies the inhibition of glucagon secretion by tolbutamide and glucose.


Figures

FIG. 1.
FIG. 1.
Glucose dependence of glucagon secretion and effect of paracrine modulators. A–C: Secretion of glucagon (A), insulin (B), and somatostatin (C) measured at 1, 6, and 20 mmol/l glucose. Data are from 50 donors (glucagon) or 33 donors (insulin and somatostatin). *P < 0.05, **P < 0.01, ***P < 0.001 versus the previous lower glucose concentration. Glucagon secretion was significantly lower at 20 mmol/l compared with 1 mmol/l glucose (P < 0.05). D: Glucagon secretion measured at 1 and 6 mmol/l glucose under control conditions and in the presence of 100 nmol/l of CYN-154806 (CYN). 100% = 3.4 ± 0.4 pg glucagon/islet/h. E: As in D but in the absence and presence of 100 nmol/l insulin. 100% = 4.9 ± 0.9 pg glucagon/islet/h. F: As in D but in the absence and presence of 30 μmol/l ZnCl2. 100% = 3.8 ± 0.5 pg glucagon/islet/h. D–F: *P < 0.05, **P < 0.01, ***P < 0.001 versus 1 mmol/l glucose (control) or as indicated by brackets.
FIG. 2.
FIG. 2.
Analysis of voltage-gated K+-currents. A: Family of voltage-activated K+-currents (lower) evoked by depolarizing pulses from −70 mV to membrane potentials between −40 and +80 mV. Inset shows inactivation of current during a 15-s depolarization from −70 to +20 mV. B: As in A but showing the initial part of the current responses during pulses to −40, −30, −20, and −10 mV on an expanded time base (sections highlighted in gray in A). C: I–V relationship for voltage-gated K+-current (n = 8). D: Example of a cell showing a clear shoulder on the I–V at voltages between +30 and +50 mV. Data are shown for the peak current (squares), the sustained current measured at the end of the 500-ms pulse (circles), and the difference (triangles).
FIG. 3.
FIG. 3.
Pharmacological characterization of voltage-gated K+-currents. A: Current responses recorded during depolarizations to +20 mV under control conditions, after addition of 10 mmol/l TEA (gray trace) and after addition of 5 mmol/l 4-aminopyridine in the continued presence of TEA (n = 4). B: As in A but pulse went to zero and currents were recorded in the absence and presence of stromatoxin (100 nmol/l, n = 4). C: As in A but pulse went to −10 mV and currents were recorded in the presence of 10 mmol/l TEA before and after application of heteropodatoxin-2 (0.5 μmol/l). D: Steady-state inactivation of the A-current analyzed by a two-pulse protocol consisting of a 200-ms conditioning pulse to membrane potentials between −90 and −20 mV followed by a 100-ms test pulse to +30 mV after an interval of 10 ms. Experiments were performed using the perforated-patch technique in the presence of TEA. E: Steady-state inactivation of the delayed-rectifying K+-current was measured by applying 15-s conditioning pulses to membrane potentials between −60 and −20 mV followed by a 500-ms test pulse to +20 mV (interval 10 ms). F: Voltage dependence of inactivation of A-current (closed circles) and delayed-rectifier current (open circles). The responses after conditioning pulses to −90 and −60 mV, respectively, were taken as unity, and data are presented as a fraction of the maximal current displayed against the voltage during the conditioning pulse. A Boltzmann function has been fit to the data points (n = 5–7). G: Glucagon secretion measured in the absence (open bars) and presence (filled bars) of 0.5 μmol/l heteropodatoxin-2 at 1 or 6 mmol/l glucose. *P < 0.01 versus 1 mmol/l glucose alone. 100% = 6.5 ± 0.8 pg/islet/h (n = 12; 4 donors). H: Effects of 100 nmol/l stromatoxin on glucagon secretion at 1 or 20 mmol/l glucose. *P < 0.05 versus 1 mmol/l glucose. 100% = 7.5 ± 1.5 pg/islet/h (n = 9; 3 donors).
FIG. 4.
FIG. 4.
Voltage-gated TTX-sensitive Na+-channels. Experiments were performed in the presence of TEA (10 mmol/l) in the extracellular solution and after replacing K+ with Cs+ in the pipette solution. A: Currents recorded under control conditions, after addition of 1 mmol/l Co2+ and after addition of TTX (0.1 μg/ml) in the continued presence of Co2+. B: Voltage dependence of Na+-currents. The responses recorded in the presence of Co2+ during depolarizations to −40, −30, −20, and −10 mV are shown. C: I–V relationship for Na+-currents (n = 5). D: Inactivation of Na+-current. A test pulse to +10 mV was preceded by 50-ms conditioning pulses to membrane potentials between −150 and 0 mV (−60 to −30 shown). Currents were recorded in the presence of Co2+. E: Inactivation curve. The response after a conditioning pulse to −150 mV was taken as unity (n = 6). A Boltzmann function fit to the mean data has been superimposed. F: Glucagon secretion measured in the absence (open bars) and presence (filled bars) of TTX (0.1 μg/ml) at 1 or 20 mmol/l glucose as indicated. 100% = 12.2 ± 3.8 pg/islet/h (n = 15; 4 donors). *P < 0.05 versus 1 mmol/l glucose alone.
FIG. 5.
FIG. 5.
Voltage-gated Ca2+-currents. Experiments were performed with TEA-containing extracellular and Cs+-containing pipette solution. A: Family of voltage-gated Ca2+-currents recorded in the presence of TTX during 100-ms depolarizations to between −60 and 0 mV as indicated. B: Current voltage relationship of whole-cell Ca2+-currents (n = 14). C: Ca2+-current recorded under control conditions and after addition of 10 μmol/l isradipine and ω-conotoxin (100 nmol/l) and ω-agatoxin (200 nmol/l) in the continued presence of isradipine as indicated. D: Ca2+-currents elicited by voltage ramps (speed, 3 V/s) under control conditions and after addition of isradipine and ω-agatoxin in the continued presence of isradipine (n = 7, 7, 4 under control conditions, in the presence of isradipine, and after addition of ω-agatoxin, respectively). E: Isradipine- (top) and ω-agatoxin-sensitive components (lower) from D. F: Ca2+-currents elicited by voltage ramps in the presence of isradipine alone (10 μmol/l) and after addition of NNC 55-0396 (3 μmol/l) in the continued presence of isradipine. The difference current (T-type; gray) is also shown. G: Inactivation of the T-type Ca2+-current. A test pulse to −30 mV was preceded by 500-ms conditioning pulses to membrane potentials between −90 and −50 mV (in the presence of 10 μmol/l isradipine). H: Voltage-dependent inactivation of T-type Ca2+-current. The current elicited after a conditioning pulse to −100 mV was taken as unity. A Boltzmann fit has been superimposed on the data points (n = 6, experiments performed in the presence of isradipine).
FIG. 6.
FIG. 6.
Effects of Ca2+-channel antagonists on glucagon secretion. A: Glucagon secretion measured in the absence (open bars) and presence (filled bars) of 10 μmol/l isradipine. *P < 0.01 versus 1 mmol/l glucose alone, †P < 0.05 versus 1 mmol/l glucose and 10 μmol/l isradipine. 100% = 10.5 ± 0.6 pg/islet/h (n = 9; 3 donors). B: Same as in A but effects of 200 nmol/l ω-agatoxin were tested. *P < 0.01 versus 1 mmol/l glucose alone, 100% = 21.1 ± 3.7 pg/islet/h (n = 9; 3 donors).
FIG. 7.
FIG. 7.
Electrical activity and [Ca2+]i oscillations. A: Membrane potential recording from an α-cell exposed to 1 mmol/l glucose. Note prominent after-hyperpolarizations after each action potential (arrows). B: Effect of tolbutamide on α-cell membrane potential in two representative cells. Note reduction of peak voltage. C: Spontaneous [Ca2+]i oscillations in an α-cell within an intact islet exposed to 1 mmol/l glucose before and during addition of 5 μmol/l adrenaline. D: As in C but testing the effects of ω-agatoxin (200 nmol/l), isradipine (10 μmol/l), Bay K8644 (10 μmol/l), and K+ (70 mmol/l) at 1 mmol/l glucose. The inset shows the segment of the recording highlighted in gray on an expanded timebase. E: Histogram summarizing the average amplitude of the [Ca2+]i oscillations under the indicated experimental conditions (13 cells in four islets obtained from two donors; *P < 0.01, **P < 0.001 vs. 1 mmol/l glucose or as indicated by brackets). F: As in D but ω-agatoxin was not applied. G: Histogram summarizing results obtained as described in F from 14 cells in four islets from two donors (**P < 0.001 vs. 1 mmol/l glucose).
FIG. 8.
FIG. 8.
Capacitance measurements of exocytosis. A: Increase in membrane capacitance evoked by 20–500-ms depolarizations from −70 to 0 mV. The circles above the capacitance traces indicate the percentage of responding cells (black part, n = 23). B: Relationship between pulse duration and exocytotic response (ΔCm; n = 23). C: Change in cell capacitance (ΔCm) evoked by 500-ms depolarizations from −70 mV to membrane potentials between −40 and +40 mV (n = 8). D: Change in cell capacitance evoked by 500-ms depolarization from −70 to 0 mV under control conditions and after addition of ω-agatoxin (200 nmol/l).

Similar articles

Cited by

References

    1. Cryer PE. Hypoglycaemia: the limiting factor in the glycaemic management of Type I and Type II diabetes. Diabetologia 2002;45:937–948 - PubMed
    1. Lefebvre PJ. (Ed.). Glucagon and Diabetes. In Handbook of Experimental Pharmacology. Berlin, Springer, 1996, p. 115–131
    1. Gromada J, Franklin I, Wollheim CB. Alpha-cells of the endocrine pancreas: 35 years of research but the enigma remains. Endocr Rev 2007;28:84–116 - PubMed
    1. Olofsson CS, Salehi A, Gopel SO, Holm C, Rorsman P. Palmitate stimulation of glucagon secretion in mouse pancreatic alpha-cells results from activation of L-type calcium channels and elevation of cytoplasmic calcium. Diabetes 2004;53:2836–2843 - PubMed
    1. Gromada J, Bokvist K, Ding WG, Barg S, Buschard K, Renstrom E, Rorsman P. Adrenaline stimulates glucagon secretion in pancreatic A-cells by increasing the Ca2+ current and the number of granules close to the L-type Ca2+ channels. J Gen Physiol 1997;110:217–228 - PMC - PubMed

Publication types

MeSH terms