

Scanning strategies do not modulate face identification: eye-tracking and near-infrared spectroscopy study
- PMID: 20548791
- PMCID: PMC2883577
- DOI: 10.1371/journal.pone.0011050
Scanning strategies do not modulate face identification: eye-tracking and near-infrared spectroscopy study
Abstract
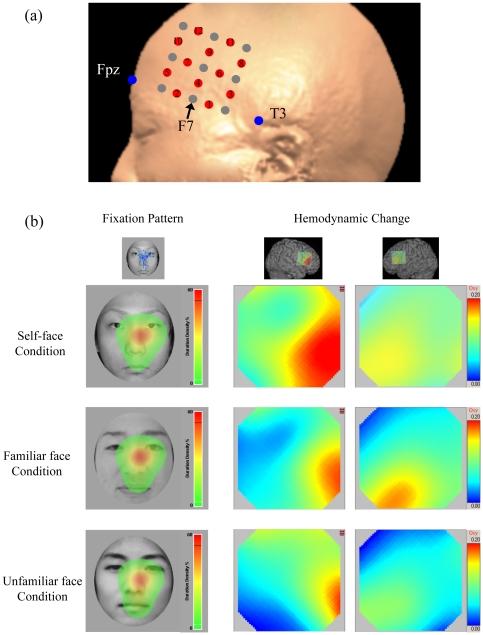
Background: During face identification in humans, facial information is sampled (seeing) and handled (processing) in ways that are influenced by the kind of facial image type, such as a self-image or an image of another face. However, the relationship between seeing and information processing is seldom considered. In this study, we aimed to reveal this relationship using simultaneous eye-tracking measurements and near-infrared spectroscopy (NIRS) in face identification tasks.
Methodology/principal findings: 22 healthy adult subjects (8 males and 14 females) were shown facial morphing movies in which an initial facial image gradually changed into another facial image (that is, the subject's own face was changed to a familiar face). The fixation patterns on facial features were recorded, along with changes in oxyhemoglobin (oxyHb) levels in the frontal lobe, while the subjects identified several faces. In the self-face condition (self-face as the initial image), hemodynamic activity around the right inferior frontal gyrus (IFG) was significantly greater than in the familiar-face condition. On the other hand, the scanning strategy was similar in almost all conditions with more fixations on the eyes and nose than on other areas. Fixation time on the eye area did not correlate with changes in oxyHb levels, and none of the scanning strategy indices could estimate the hemodynamic changes.
Conclusions/significance: We conclude that hemodynamic activity, i.e., the means of processing facial information, is not always modulated by the face-scanning strategy, i.e., the way of seeing, and that the right IFG plays important roles in both self-other facial discrimination and self-evaluation.
Conflict of interest statement
Figures


Similar articles
-
A more featural based processing for the self-face: An eye-tracking study.Conscious Cogn. 2022 Oct;105:103400. doi: 10.1016/j.concog.2022.103400. Epub 2022 Aug 26. Conscious Cogn. 2022. PMID: 36030615
-
[Slowing down the flow of facial information enhances facial scanning in children with autism spectrum disorders: A pilot eye tracking study].Encephale. 2017 Feb;43(1):32-40. doi: 10.1016/j.encep.2016.02.005. Epub 2016 Mar 16. Encephale. 2017. PMID: 26995150 French.
-
Scan patterns during the processing of facial identity in prosopagnosia.Exp Brain Res. 2007 Aug;181(2):199-211. doi: 10.1007/s00221-007-0923-2. Epub 2007 Mar 15. Exp Brain Res. 2007. PMID: 17361425
-
The neuroanatomic basis of facial perception and variable facial discrimination ability: implications for orthodontics.Am J Orthod Dentofacial Orthop. 2007 Sep;132(3):293-301. doi: 10.1016/j.ajodo.2006.04.031. Am J Orthod Dentofacial Orthop. 2007. PMID: 17826596 Review.
-
[Mechanisms of face perception in humans: an MEG study].Brain Nerve. 2012 Jul;64(7):727-35. Brain Nerve. 2012. PMID: 22764344 Review. Japanese.
Cited by
-
Self-Face Recognition in Schizophrenia: An Eye-Tracking Study.Front Hum Neurosci. 2016 Feb 10;10:3. doi: 10.3389/fnhum.2016.00003. eCollection 2016. Front Hum Neurosci. 2016. PMID: 26903833 Free PMC article.
-
Reducing the neural search space for hominid cognition: what distinguishes human and great ape brains from those of small apes?Psychon Bull Rev. 2014 Jun;21(3):590-619. doi: 10.3758/s13423-013-0559-0. Psychon Bull Rev. 2014. PMID: 24481882 Review.
-
Self-face advantage over familiar and unfamiliar faces: A three-level meta-analytic approach.Psychon Bull Rev. 2018 Aug;25(4):1287-1300. doi: 10.3758/s13423-018-1487-9. Psychon Bull Rev. 2018. PMID: 29799093
-
Culture modulates face scanning during dyadic social interactions.Sci Rep. 2020 Feb 6;10(1):1958. doi: 10.1038/s41598-020-58802-0. Sci Rep. 2020. PMID: 32029826 Free PMC article.
-
Predominance of eyes and surface information for face race categorization.Sci Rep. 2021 Jan 21;11(1):1927. doi: 10.1038/s41598-021-81476-1. Sci Rep. 2021. PMID: 33479387 Free PMC article.
References
-
- Bruce V. Changing faces: visual and non-visual coding processes in face recognition. Br J Psychol. 1982;73(Pt 1):105–116. - PubMed
-
- Field TM, Cohen D, Robert G, Reena G. Mother-stranger face discrimination by the newborn. Infant Behav Dev. 1984;7(1):19–25.
-
- Bushnell IWR. The origins of face perception. In: Simion F, Butterworth G, editors. The development of sensory, motor and cognitive capasities in early infancy: from perception to cognition. UK: Psychology Press; 1998. pp. 69–86.
-
- Amsterdam B. Mirror self-image reactions before age two. Dev Psychobiol. 1972;5(4):297–305. - PubMed
-
- Tong F, Nakayama K. Robust Representations for faces: Evidence from visual search. J Exp Psychol Hum Percept Perform. 1999;25(4):1016–1035. - PubMed
Publication types
MeSH terms
LinkOut - more resources
Full Text Sources
