. 2010 Jul;47(3):205-19.
doi: 10.1007/s10858-010-9424-x. Epub 2010 Jun 15.

Major groove width variations in RNA structures determined by NMR and impact of 13C residual chemical shift anisotropy and 1H-13C residual dipolar coupling on refinement

Affiliations

Major groove width variations in RNA structures determined by NMR and impact of 13C residual chemical shift anisotropy and 1H-13C residual dipolar coupling on refinement

Blanton S Tolbert et al. J Biomol NMR. 2010 Jul.

Abstract

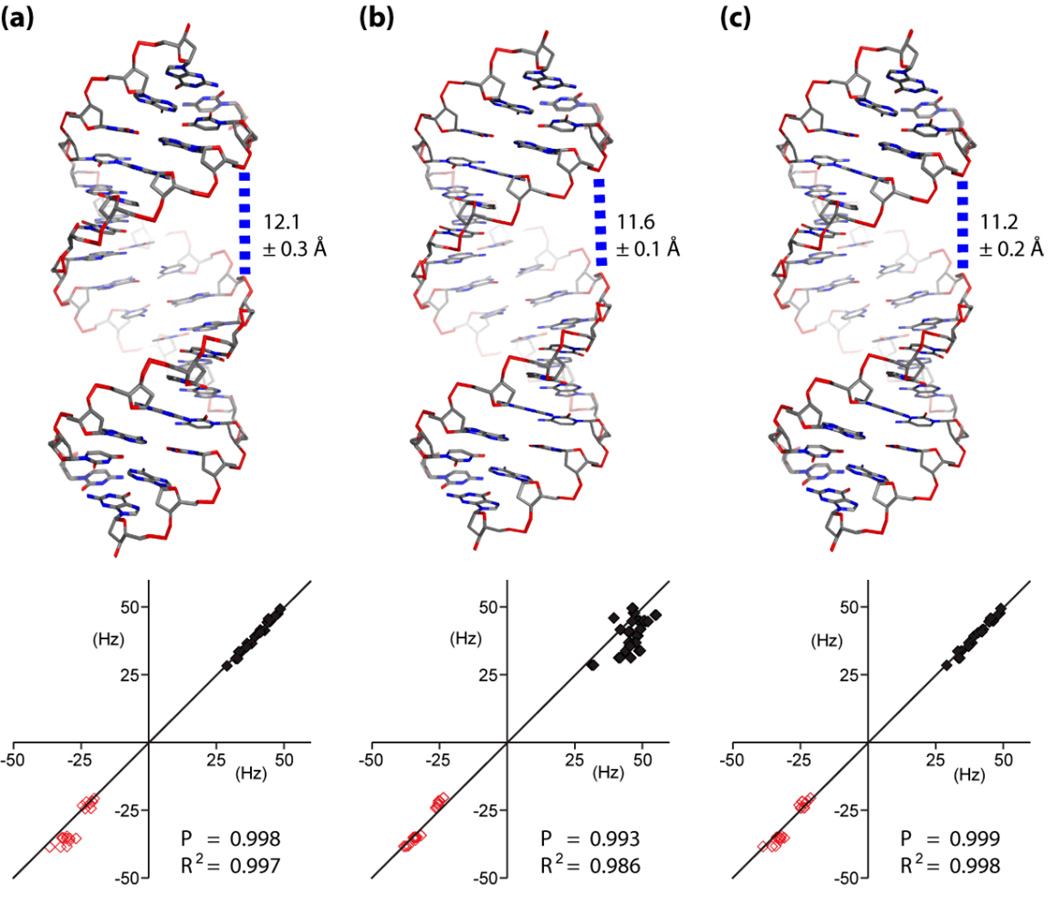
Ribonucleic acid structure determination by NMR spectroscopy relies primarily on local structural restraints provided by (1)H- (1)H NOEs and J-couplings. When employed loosely, these restraints are broadly compatible with A- and B-like helical geometries and give rise to calculated structures that are highly sensitive to the force fields employed during refinement. A survey of recently reported NMR structures reveals significant variations in helical parameters, particularly the major groove width. Although helical parameters observed in high-resolution X-ray crystal structures of isolated A-form RNA helices are sensitive to crystal packing effects, variations among the published X-ray structures are significantly smaller than those observed in NMR structures. Here we show that restraints derived from aromatic (1)H- (13)C residual dipolar couplings (RDCs) and residual chemical shift anisotropies (RCSAs) can overcome NMR restraint and force field deficiencies and afford structures with helical properties similar to those observed in high-resolution X-ray structures.


Figures

Figure 1
Figure 1
Plots showing mean dP-P distances (average of the cross-major groove distances between the P atoms of base pairs (i) and (i+6)) of X-ray and NMR structures deposited in the RNA structure database. (a) X-ray structures (< 2.5 Å resolution) of unmodified, A-form helical RNAs, including those with non-canonical base pairs (Table 1 and Suppl. Table S1) (b) NMR structures of A-form helical RNAs deposited from 2005 through 2009 (Suppl. Table S2).
Figure 2
Figure 2
(a) 1H-13C IMC pulse sequence used for selective observation of the Tr(1H)-Tr(13C) component of purine and pyrimidine aromatic 1H-13C multiplets. Decoupling during the evolution period (incremented at Δt) is achieved using broad band hyperbolic secant (a, 1.33 msec; 13.5 kHz bandwidth) and selective IBURP (Green and Freeman 1991) (b, 2.67 msec, 1.69 kHz bandwidth; c, 1.33 msec, 3.37 kHz bandwidth) inversion pulses; τ= 1/4J = 1.2 ms. Phases for collection of the Tr(1H)-Tr(13C) component are: ϕ0,7 = x, ϕ1,5 = y, ϕ2 = x,x, −x, −x; ϕ3 = x,y; ϕ4 = y; ϕ6 = −x; ϕ8 = x, −x, −x,x. ϕ7 was empirically adjusted (−38° in all experiments) to balance the effect of differential relaxation rates of single and multiple quantum coherence. Other components are collected using the following phases: anti-Tr(1H-)-Tr(13C): ϕ7 = −x; Tr(1H)-anti-Tr(13C): ϕ1,4 = −y; anti-Tr(1H)-anti-Tr(13C): ϕ7 = −x; ϕ1,4 = −y. Echo-Antiecho quadrature detection is achieved by incrementing the phase ϕ7 and ϕ8 by 180 degrees and reversing the signs of gradients 2 and 3. The selective 1H IBURP pulse was only used for detection of pyrimidine C5-H5 and C6-H6 signals, and was centered at the non-observed aromatic proton frequency. Relative pulsed field gradient (PFG) strengths (sine shapes): G0, 500µs, 31%; G1, 400 µs, 41%; G2 200 µs, 50%; G3, 200 µs, −50%; G4, 100 µs, 50%. (b) Nucleotide sequence and secondary structure of [DIS]2. (c) Portions of the RPCSA (blue, black) and Tr(13C)-Tr(1H) IMC (red, green) spectra obtained for [A,G(13C)-DIS]2 in the absence (blue, green) and presence (black, red) of Pf1 phage. Inset: Relationship between RDC and RPCSA.
Figure 3
Figure 3
(a) Superposition of 20 [DIS]2 Cyana structures, from 200 total, generated using loose NOE, hydrogen bond, and backbone torsion angle restraints. (b–d) MD simulations with Amber using NOE-derived distance, hydrogen bond, and planarity/chirality restraints (trajectory snapshots for MD simulations conducted at 0 K and 300 K are shown in (b) and (c), respectively) result in an expansion of the major groove, with dP-P distances (dashed arrows) increasing from 6.6 ± 1.2 Å to 13.6 ± 0.3 Å. (d) Superposition of Cyana structures after refinement with Amber using only chirality and H-bond restraints (by minimization (blue) or annealing followed by minimization (green)) and upon inclusion of NOE-derived distance restraints (red).
Figure 4
Figure 4
Plots of molecular superpositions (top) and experimental (vertical) versus back-calculated (horizontal) RDC (black) and RCSA (red) data in Hz (bottom) for representative [DIS]2 structures calculated with Cyana and refined with Amber. To facilitate comparisons, the horizontal line has a slope of 1.0. Pearson (P) and correlation coefficient (R2) statistics for the experimental vs. calculated data are also shown. (a) Cyana structures generated using NOE-derived distance and H-bond restraints. (b,c) Amber structures generated by MD refinement of the Cyana structures (b) using only the ff99 force field with GB solvent simulation and no additional restraints, and (c) using NOE-derived distance, H-bond and chirality restraints.
Figure 5
Figure 5
Plots of molecular superpositions (top) and representative experimental (vertical) versus back-calculated (horizontal) RDC (black) and RCSA (red) data (bottom) for 20 Amber structures after minimization using (a) NOE+RDC restraints, (b) NOE+RCSA restraints (with a fixed alignment tensor – see text), and (c) NOE+RDC+RCSA restraints. The starting structures for all three sets of calculations are shown in Fig. 3c, and all calculations led to reductions in major groove widths to values consistent with high-resolution RNA X-ray structures. The horizontal line is plotted with a slope of 1.0, and Pearson (P) and R2 fits are shown.
Figure 6
Figure 6
(a–d) Plots of molecular superpositions (top) and representative experimental (vertical) versus back-calculated (horizontal) RDC (black) and RCSA (red) data (bottom) for [DIS]2 RNA structures refined with Amber using a modified GB force field in which the electrostatic term was reduced to 10% of the normal value. The 20 initial Cyana structures (Fig. 4a) were refined using the following restraint combinations: (a) NOE-only; (b) NOE+RDC+RCSA; (c) NOE+RDC; (d) NOE+RCSA (with fixed alignment tensor). (e,f) Representative structures obtained upon simultaneous refinement of the atomic coordinates and orientation tensor using only the NOEs and RCSAs as restraints. Although both structures and their corresponding alignment tensors are compatible with the RCSA data, the predicted alignment tensor for (f) is highly asymmetric and incompatible with both the calculated rotational diffusion tensor and the experimental RDCs (see Table 3). These findings illustrate the potential limitations of using RCSAs alone for simultaneous structure/tensor calculations (see text for details).
Figure 7
Figure 7
Distribution of (a) RDC and (b) RCSA restraints used for structure calculations; RNA in gray, 13C-1H vectors shown as blue sticks, 13C RCSAs for purines and pyrimidines shown as spheres (blue and red, respectively). The structure corresponds to that shown in Fig. 5f, which was calculated using only RCSA restrains and has a collapsed major groove. The eigenvectors of the Saupe alignment tensor are also shown (zz = cyan, xx = red, yy = blue; eigenvalues |zz|:|xx|:|yy| ≈ 3:2:1). The rhombicity of the tensor relative to the helix axis in this structure correlates with the asymmetric restraint distribution (see text).

Similar articles

Cited by

References

    1. Al-Hashimi HM. Beyond static structures of RNA by NMR: folding, refolding, and dynamics at atomic resolution. Biopolymers. 2007;86:345–347. - PubMed
    1. Al-Hashimi HM, Gorin A, Majumdar A, Patel DJ. Alignment of the HTLV-I Rex peptide bound to its target RNA aptamer from magnetic field-induced residual dipolar couplings and intermolecular hydrogen bonds. J Am Chem Soc. 2001a;123:3179–3180. - PubMed
    1. Al-Hashimi HM, Gosser Y, Gorin A, Hu W, Majumdar A, Patel DJ. Concerted motions in HIV-1 TAR RNA may allow access to bound state conformations: RNA dynamics from NMR residual dipolar couplings. J Mol Biol. 2002;315:95–102. - PubMed
    1. Al-Hashimi HM, Majumdar A, Gorin A, Kettani A, Skripkin E, Patel DJ. Field-and phage-induced dipolar couplings in a homodimeric DNA quadruplex: relative orientation of G.(C-A) triad and G-tetrad motifs and direct determination of C2 symmetry axis orientation. J Am Chem Soc. 2001b;123:633–640. - PubMed
    1. Al-Hashimi HM, Patel DJ. Residual dipolar couplings: synergy between NMR and structural genomics. J Biomol NMR. 2002;22:1–8. - PubMed

Publication types

MeSH terms

LinkOut - more resources