. 2010 Jul 7;132(26):8961-72.
doi: 10.1021/ja100447p.

Structural assembly of molecular complexes based on residual dipolar couplings

Affiliations

Structural assembly of molecular complexes based on residual dipolar couplings

Konstantin Berlin et al. J Am Chem Soc. .

Abstract

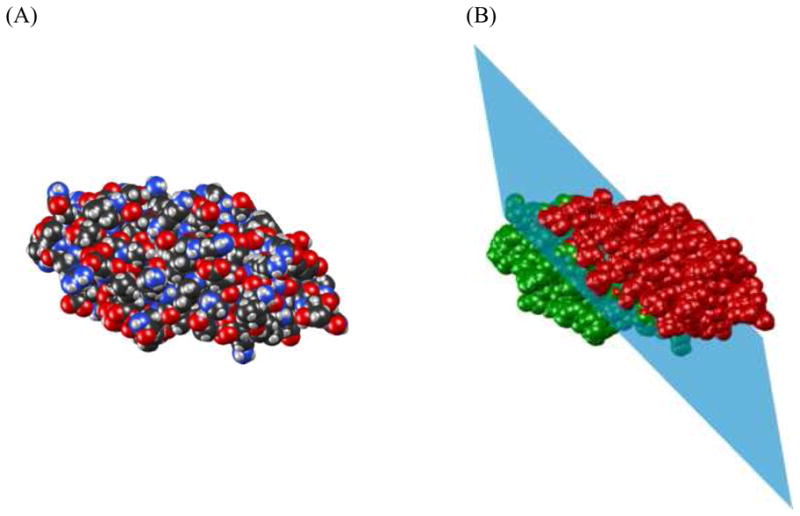
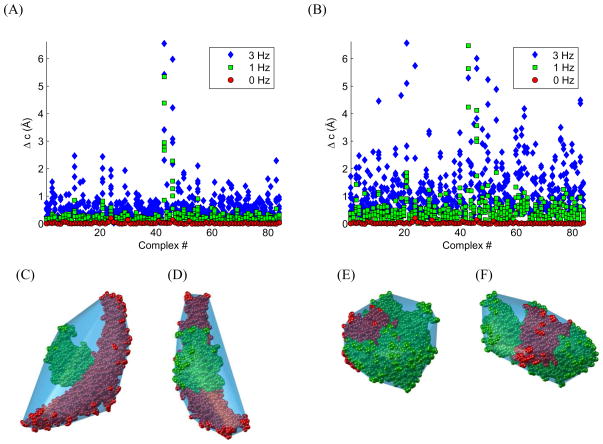
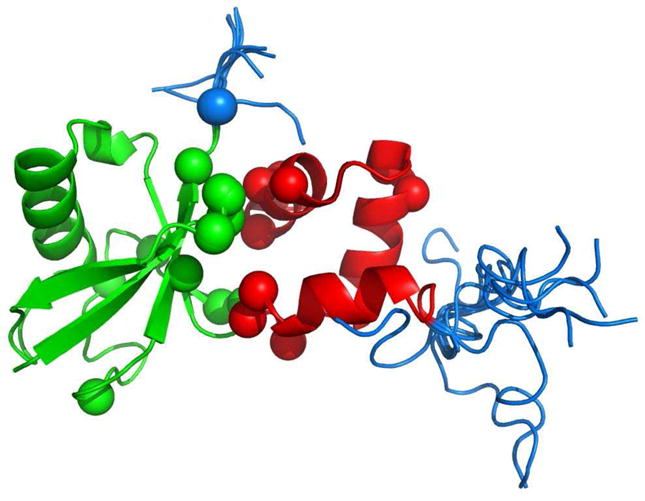
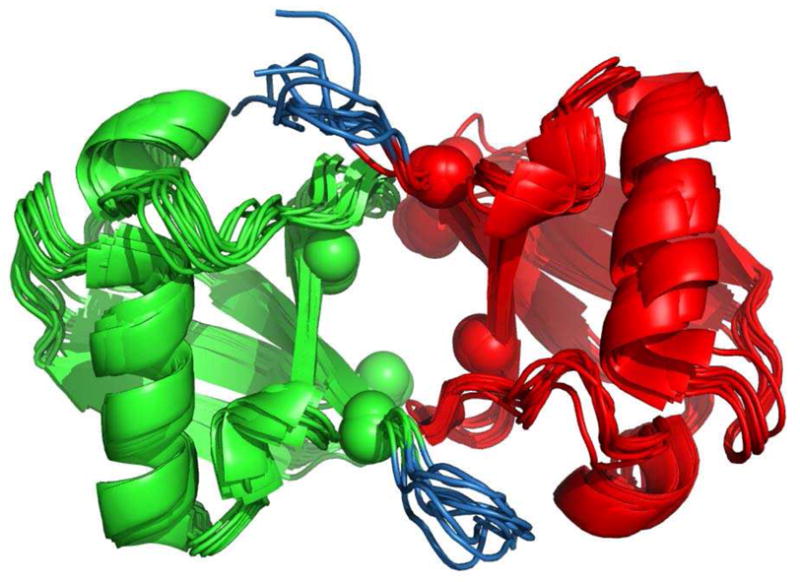
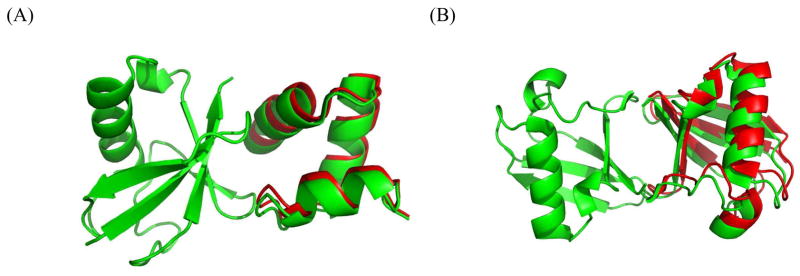
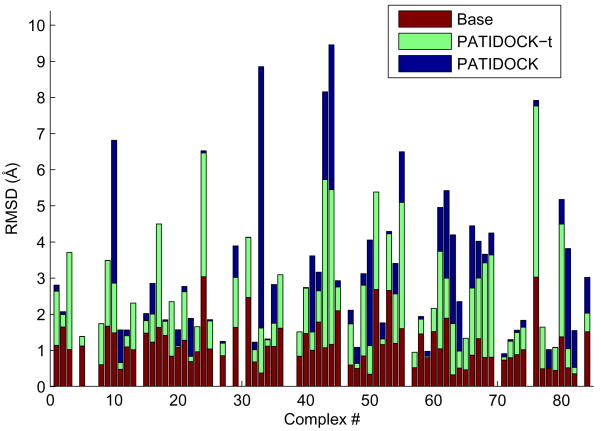
We present and evaluate a rigid-body molecular docking method, called PATIDOCK, that relies solely on the three-dimensional structure of the individual components and the experimentally derived residual dipolar couplings (RDCs) for the complex. We show that, given an accurate ab initio predictor of the alignment tensor from a protein structure, it is possible to accurately assemble a protein-protein complex by utilizing the RDCs' sensitivity to molecular shape to guide the docking. The proposed docking method is robust against experimental errors in the RDCs and computationally efficient. We analyze the accuracy and efficiency of this method using experimental or synthetic RDC data for several proteins, as well as synthetic data for a large variety of protein-protein complexes. We also test our method on two protein systems for which the structure of the complex and steric-alignment data are available (Lys48-linked diubiquitin and a complex of ubiquitin and a ubiquitin-associated domain) and analyze the effect of flexible unstructured tails on the outcome of docking. The results demonstrate that it is fundamentally possible to assemble a protein-protein complex solely on the basis of experimental RDC data and the prediction of the alignment tensor from 3D structures. Thus, despite the purely angular nature of RDCs, they can be converted into intermolecular distance/translational constraints. Additionally, we show a method for combining RDCs with other experimental data, such as ambiguous constraints from interface mapping, to further improve structure characterization of protein complexes.


Figures

Figure 1
Figure 1
Illustration of the bisection of Cyanovirin-N (PDB code 2EZM). (A) Van der Waals surface of Cyanovirin-N. (B) Illustration of how the protein is split into two domains with approximately equal number of atoms by a plane. The first domain is colored green, the second domain is red.
Figure 2
Figure 2
PATIDOCK-t docking results for the 84 complexes in the COMPLEX dataset using synthetic RDC values with no noise (0 Hz, red circles) or in the presence of a Gaussian noise with the standard deviation of 1 Hz (green squares) or 3 Hz (blue diamonds) (see Supporting Table S1). (A) PATIDOCK-t docking results when all of the NH bond vectors are used in the computation of the alignment tensor. (B) PATIDOCK-t docking results when only 100 randomly selected NH bond vectors from the complex are used. Similar results were obtained when using only 50 randomly selected NH bond vectors (Supporting Table S1). The height constant h was adjusted for each complex to give a Da value of 20 Hz for Ãsyn, which corresponds to the average Da value of the SINGLE dataset, ubiquitin/UBA complex, and di-ubiquitin complex. In the case of noisy data, docking of each complex was performed six times, with individual RDC errors randomly selected from a normal distribution. All six results for each complex with RDC errors are plotted. For the purposes of visualization a few outliers for complexes 43 and 46 are not displayed. Bigger errors for some complexes reflect a much lesser sensitivity of the molecular shape (hence of the alignment tensor) of these specific complexes to translations of one domain relative to the other. (C-F) Van der Waals surface representation of the major outliers: (C-D) complex #43, PDB code 1I4D (mass 47 kDa, S1=chain D, S2=chains A and B); (E-F) complex #46, PDB code 1IBR (mass 77 kDa, S1=chain B, S2=chain A). The structures in (D) and (F) are rotated counterclockwise around the z-axis by 90°. The individual domains are colored green (S1) and red (S2), the convex hull of the complex is colored light blue.
Figure 3
Figure 3
A cartoon representation of the ensemble of 100 possible models for the Ub/UBA complex (Structure 2jy6-I). Ub is colored green, UBA is in red, the flexible tails are colored blue, and the CSP-active residues are represented by spheres around their Cα atoms.
Figure 4
Figure 4
The results of RDC-guided docking for the tailless Ub/UBA complex (2jy6-II) using PATIDOCK-t. Shown are (A–B) isosurface plots of the χ2(x) function and (C-D) the associated van der Waals surfaces (wrapped by their convex hulls) of the two solutions corresponding to the two local minima of χ2(x). The isosurfaces correspond to (A) minxχ2(x) + 0.1σ and (B) minxχ2(x) + 0.6σ, for all x inside the grid, where σ is the standard deviation of the values of χ2 in the grid. The isosurface data were collected on a 100 × 100 × 100 Å grid around 0. (C) The best (closest) solution with the UBA domain positioned to the right of Ub, with χ2 = 2.01 × 10⁻⁷ at the solution. (D) The incorrect solution where the UBA domain is to the left of Ub, with χ2 = 1.24 ×10⁻⁷ at the solution. In these van der Waals surface plots Ub is colored green and UBA is red. Both solutions have a very similar convex hull, hence similar predicted alignment tensor. The camera angle relative to Ub’s orientation is the same in both figures. Note that the best solution has a higher χ2 value.
Figure 5
Figure 5
A cartoon representation of the ensemble of 10 models for the di-Ubiquitin complex (Structure 2bgf-I). Proximal domain is colored green, distal domain is in red, the flexible tails are colored blue, and the CSP-active residues are represented by spheres around their Cα atoms.
Figure 6
Figure 6
A cartoon representation of the actual structure (green) vs. the docked structure (red) for the (A) Ub/UBA complex and (B) Ub2 molecule based on minimization of χF2. Only the adjusted domain (S2, right) is shown for the docked structures, the other domain (S1, left) superimposes exactly with the corresponding domain in the actual structure.
Figure 7
Figure 7
The results of PATIDOCK-t (green bars) and PATIDOCK (blue bars) assembly of complexes of “unbound” structures of the proteins from the COMPLEX dataset, using synthetically generated alignment tensors from the corresponding “bound” complexes as the target experimental alignment tensor to guide the docking. Shown are backbone RMSDs between the resulting (unbound) complex and the original (bound) complex. “Base” RMSDs (red bars) reflect the structural differences between the unbound and bound structures of the individual domains, calculated by superimposing the unbound structure of each domain onto the bound structure in the complex and computing the overall RMSD. Missing bars correspond to those few complexes where we were unable to properly match the atoms between the bound and the unbound coordinate sets.

References

    1. Tolman J, Flanagan J, Kennedy M, Prestegard J. Proceedings of the National Academy of Sciences of the United States of America. 1995;92:9279–9283. - PMC - PubMed
    1. Tjandra N, Bax A. Science. 1997;278:1111–1114. - PubMed
    1. Bax A. Protein Science. 2003;12:1–16. - PMC - PubMed
    1. Zweckstetter M, Bax A. Journal of the American Chemical Society. 2000;122:3791–3792.
    1. Fernandes MX, Bernado P, Pons M, Garcia de la Torre J. Journal of the American Chemical Society. 2001;123:12037–12047. - PubMed

Publication types