. 2010 Jul 27;4(7):4110-6.
doi: 10.1021/nn1010232.

Correlative fluorescence microscopy and scanning transmission electron microscopy of quantum-dot-labeled proteins in whole cells in liquid

Affiliations

Correlative fluorescence microscopy and scanning transmission electron microscopy of quantum-dot-labeled proteins in whole cells in liquid

Madeline J Dukes et al. ACS Nano. .

Abstract

Correlative fluorescence microscopy and transmission electron microscopy (TEM) is a state-of-the-art microscopy methodology to study cellular function, combining the functionality of light microscopy with the high resolution of electron microscopy. However, this technique involves complex sample preparation procedures due to its need for either thin sections or frozen samples for TEM imaging. Here, we introduce a novel correlative approach capable of imaging whole eukaryotic cells in liquid with fluorescence microscopy and with scanning transmission electron microscopy (STEM); there is no additional sample preparation necessary for the electron microscopy. Quantum dots (QDs) were bound to epidermal growth factor (EGF) receptors of COS7 fibroblast cells. Fixed whole cells in saline water were imaged with fluorescence microscopy and subsequently with STEM. The STEM images were correlated with fluorescence images of the same cellular regions. QDs of dimensions 7x12 nm were visible in a 5 microm thick layer of saline water, consistent with calculations. A spatial resolution of 3 nm was achieved on the QDs.


Figures

Figure 1
Figure 1
Schematic of experimental setup for correlative light microscopy and liquid scanning transmission electron microscopy (STEM). Images are not drawn to scale. (a) Microfluidic chamber for liquid STEM consisting of two microchips each supporting an electron transparent window. Cells are directly grown on the top microchip. The bottom microchip contains a spacer (not shown). This chamber is placed in the vacuum of the STEM and imaged with a scanning electron beam. Transmitted electrons are detected. (b) Contrast is obtained in liquid STEM on nanoparticles specifically attached to surface proteins of the cell. (c) For imaging with light microscopy, prior to liquid STEM imaging, the microchip with the attached cells is placed up-side-down in a glass bottom culture dish and imaged using an oil-immersion lens.
Figure 2
Figure 2
Correlative light microscopy and liquid STEM of intact fixed eukaryotic cells in saline water. (a) Direct Interference Contrast (DIC) image (grey) with overlaid fluorescent signal (red) of a microchip with COS7 cells showing the regions with quantum dot (QD) labeled epidermal growth factor (EGF) receptors. The rectangular shape outlines the silicon nitride window. (b) Fluorescent signals (red) showing cellular regions with EGF receptors. Some fluorescence from the fixative is also visible. (c) Liquid STEM image of the region indicated with a square #1 in (b). Individual QDs along the edge of the cell can be discerned as yellow spots on a blue background. Some debris can be seen as well. The magnification was M = 48,000. The signal intensity was color-coded to increase the visibility of the labels
Figure 3
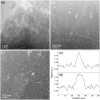
Figure 3
Liquid STEM images of a COS7 cell labeled with EGF-QD. (a) A cellular region at the position of the square #2 in Figure 2b recorded at M = 16,000. (b) Image recorded at a region just at the bottom of the figure in (a) at M = 32,000. QDs are visible as bright spots. (c) Image recorded at M = 160,000 revealing the shape of the QDs. (d) Line scan over the QD indicated with the arrow in (c) over the short dimension of the QD. (e) Line scan over the same QD as in (d), but over the long dimension. The background level was set to zero.

Similar articles

Cited by

References

    1. Lippincott-Schwartz J, Snapp E, Kenworthy A. Studying Protein Dynamics in Living Cells. Nature Reviews. 2001;2:444–456. - PubMed
    1. Hell SW. Far-Field Optical Nanoscopy. Science. 2007;316:1153–1158. - PubMed
    1. Stahlberg H, Walz T. Molecular Electron Microscopy: State of the Art and Current Challenges. ACS Chem Biol. 2008;3:268–281. - PMC - PubMed
    1. Leis A, Rockel B, Andrees L, Baumeister W. Visualizing Cells at the Nanoscale. Trends Biochem Sci. 2009;34:60–70. - PubMed
    1. Sun MG, Williams J, Munoz-Pinedo C, Perkins GA, Brown JM, Ellisman MH, Green DR, Frey TG. Correlated Three-Dimensional Light and Electron Microscopy Reveals Transformation of Mitochondria During Apoptosis. Nat Cell Biol. 2007;9:1057–65. - PubMed

Publication types

MeSH terms