. 2010 Jun;127(6):3666-77.
doi: 10.1121/1.3377053.

The role of off-frequency masking in binaural hearing

Affiliations

The role of off-frequency masking in binaural hearing

Emily Buss et al. J Acoust Soc Am. 2010 Jun.

Abstract

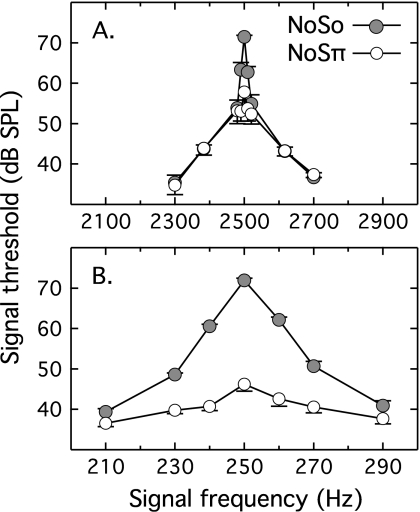
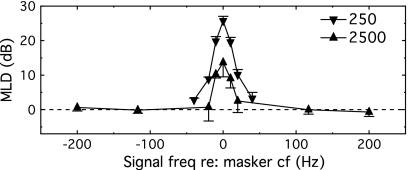
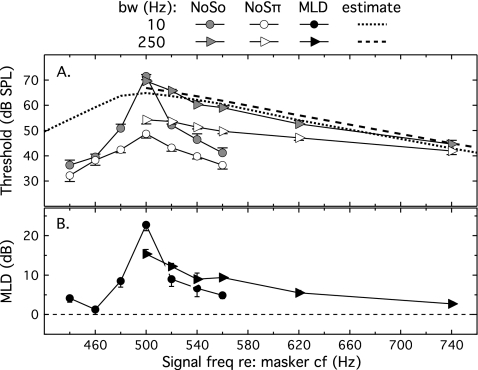
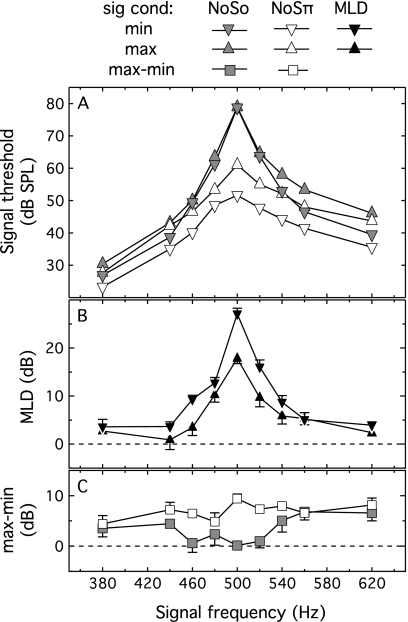
The present studies examined the binaural masking level difference (MLD) for off-frequency masking. It has been shown previously that the MLD decreases steeply with increasing spectral separation between a pure tone signal and a 10-Hz wide band of masking noise. Data collected here show that this reduction in the off-frequency MLD as a function of signal/masker separation is comparable at 250 and 2500 Hz, indicating that neither interaural phase cues nor frequency resolution are critical to this finding. The MLD decreases more gradually with spectral separation when the masker is a 250-Hz-wide band of noise, a result that implicates the rate of inherent amplitude modulation of the masker. Thresholds were also measured for a brief signal presented coincident with a local masker modulation minimum or maximum. Sensitivity was better in the minima for all NoSpi and off-frequency NoSo conditions, with little or no effect of signal position for on-frequency NoSo conditions. Taken together, the present results indicate that the steep reduction in the off-frequency MLD for a narrowband noise masker is due at least in part to envelope cues in the NoSo conditions. There was no evidence of a reduction in binaural cue quality for off-frequency masking.


Figures

Figure 1
Figure 1
Mean thresholds are plotted as a function of signal frequency, indicated on the abscissa in Hz. The top panel (a) shows thresholds with a 10-Hz-wide masker centered on 2500 Hz, and the bottom panel (b) shows thresholds with a 10-Hz-wide masker centered on 250 Hz. Signal phase is indicated with symbol type: NoSo results are plotted with filled circles and NoSπ with open circles. Error bars show 1 standard error of the mean (n=5). Those bars extend above the mean for NoSo data and below the mean for NoSπ data in order to prevent ambiguity where points overlap.
Figure 2
Figure 2
Mean values of MLD are plotted as a function of signal frequency relative to the masker center frequency. Symbols indicate the masker cf: 250-Hz values are plotted with down-pointing triangles and 2500-Hz values with up-pointing triangles. Error bars indicate 1 standard error of the mean across values for individual observers (n=5). The dashed horizontal line indicates no benefit in the NoSπ as compared to NoSo condition.
Figure 3
Figure 3
The top panel (a) shows mean thresholds, plotted as a function of signal frequency indicated on the abscissa in Hz. Lines indicate associated estimates of energetic masking predicted on the basis of partial loudness for NoSo stimulation. The bottom panel (b) shows the corresponding MLD. In both panels circles indicate thresholds with the 10-Hz masker bandwidth (60 dB∕Hz spectrum level), and triangles indicate data for the 250-Hz masker bandwidth (55 dB∕Hz spectrum level). Thresholds for NoSo are shown with open symbols, thresholds for NoSπ are shown with gray symbols, and MLDs are shown with solid black. Error bars indicate 1 standard error of the mean (n=6).
Figure 4
Figure 4
The top panel (a) shows mean thresholds plotted as a function of signal frequency indicated on the abscissa in Hz. The middle panel (b) shows corresponding values of MLD, and the bottom panel (c) shows the difference between thresholds in the max and min masker conditions. Symbols correspond to stimulus condition, as shown in the legend. Error bars in the bottom two panels indicate 1 standard error of the mean (n=5).

Similar articles

Cited by

References

    1. Akeroyd, M. A., and Summerfield, A. Q. (1999). “A binaural analog of gap detection,” J. Acoust. Soc. Am. JASMAN 105, 2807–2820.10.1121/1.426897 - DOI - PubMed
    1. ANSI (2004). ANSI S3.6–2004, American National Standard Specification for Audiometers (American National Standards Institute, New York: ).
    1. Bernstein, L. R., and Trahiotis, C. (2002). “Enhancing sensitivity to interaural delays at high frequencies by using “transposed stimuli”,” J. Acoust. Soc. Am. JASMAN 112, 1026–1036.10.1121/1.1497620 - DOI - PubMed
    1. Bos, C. E., and de Boer, E. (1966). “Masking and discrimination,” J. Acoust. Soc. Am. JASMAN 39, 708–715.10.1121/1.1909945 - DOI
    1. Buss, E. (2008). “The effect of masker level uncertainty on intensity discrimination,” J. Acoust. Soc. Am. JASMAN 123, 254–264.10.1121/1.2812578 - DOI - PMC - PubMed

Publication types