. 2010 Jun;127(6):3678-88.
doi: 10.1121/1.3409488.

Auditory and visual orienting responses in listeners with and without hearing-impairment

Affiliations

Auditory and visual orienting responses in listeners with and without hearing-impairment

W Owen Brimijoin et al. J Acoust Soc Am. 2010 Jun.

Abstract

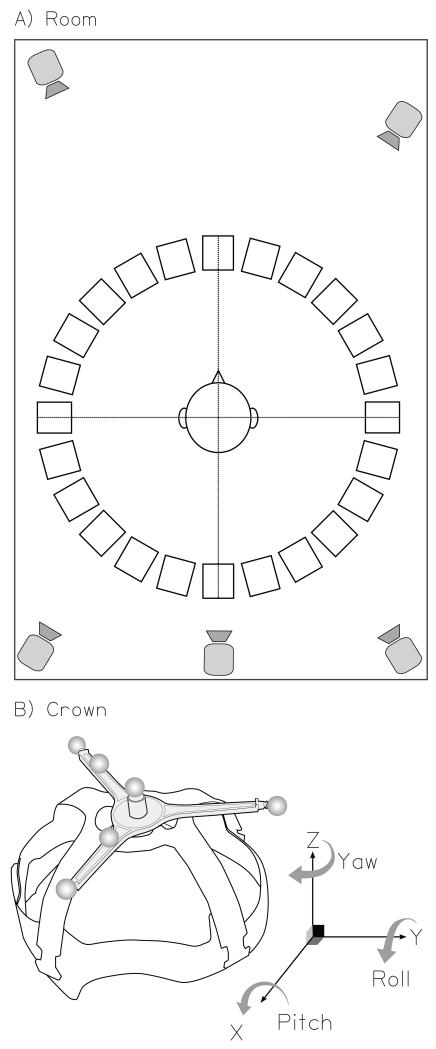
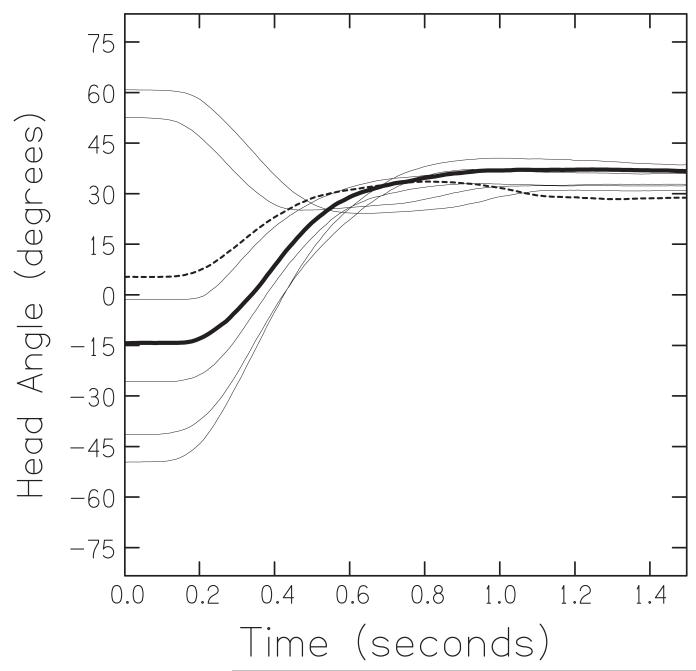
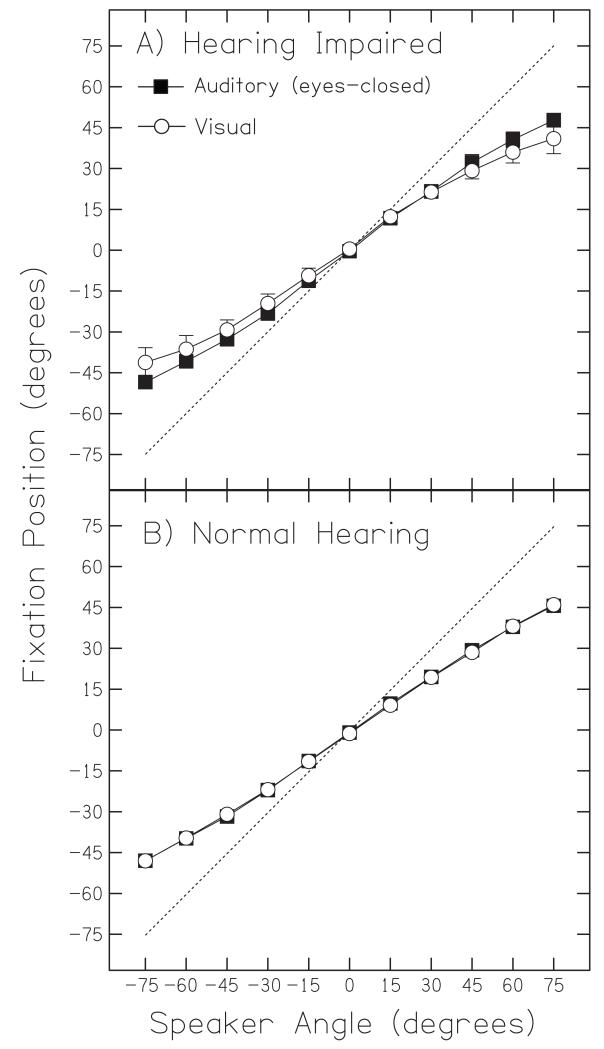
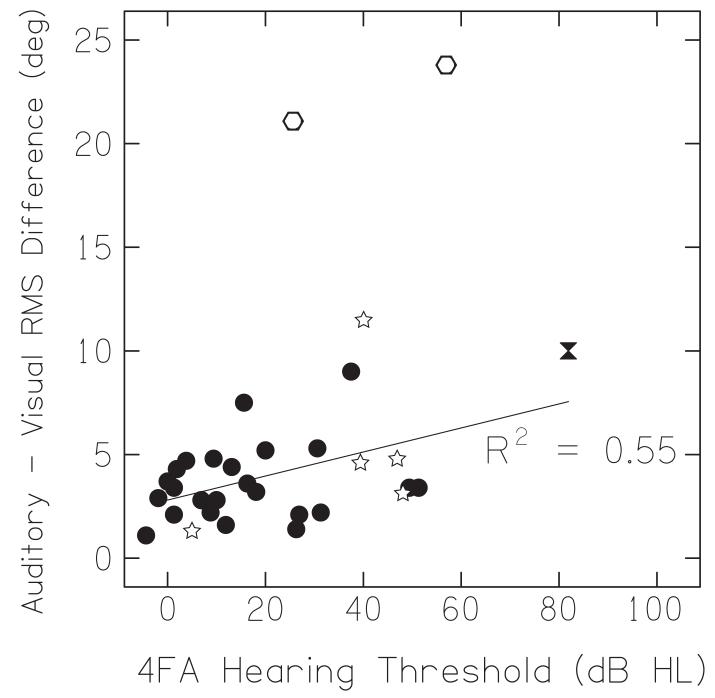
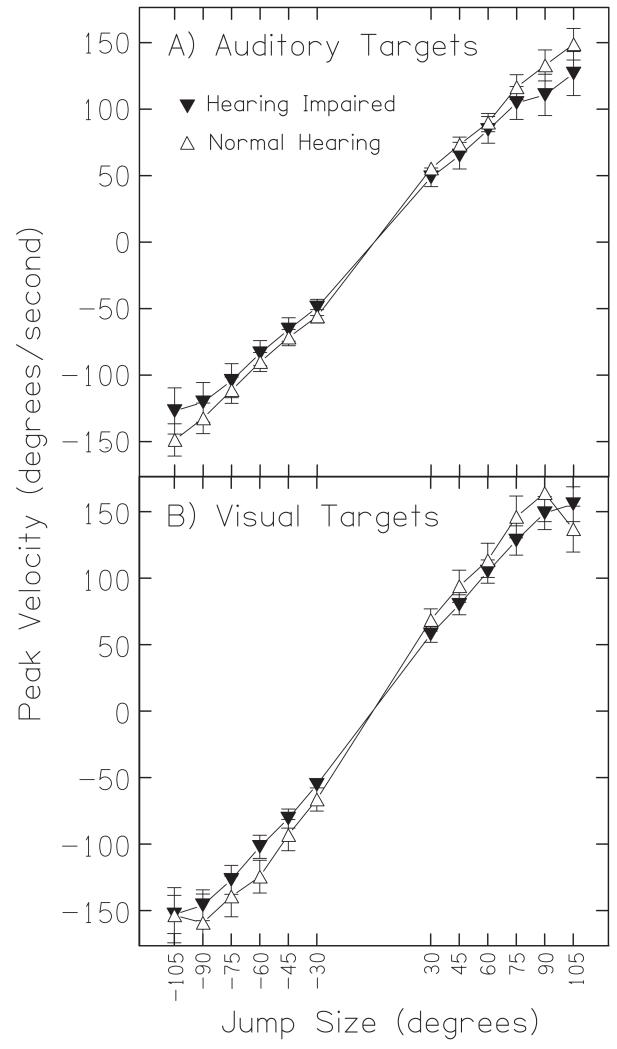
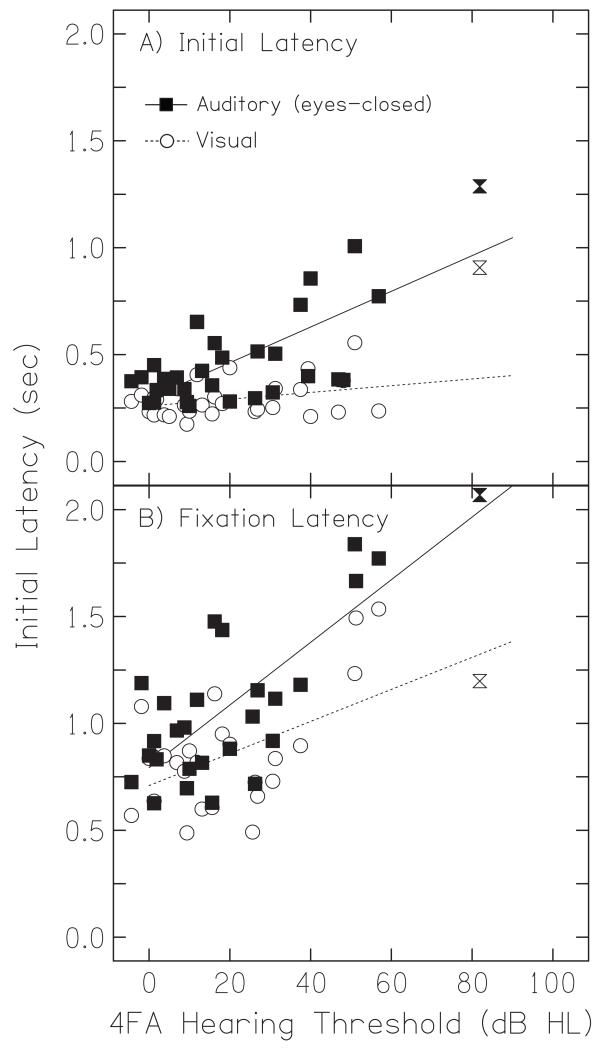
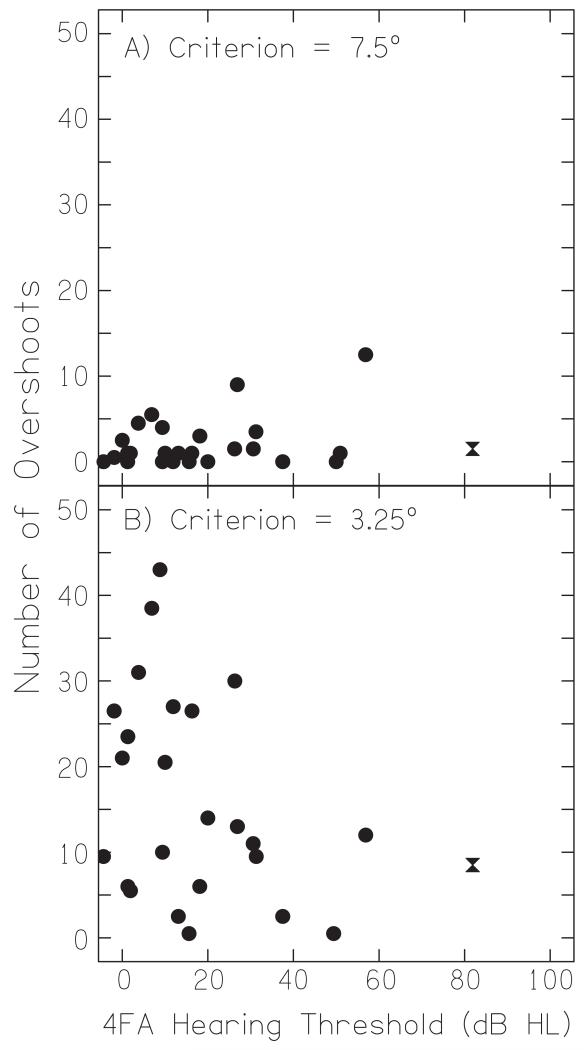
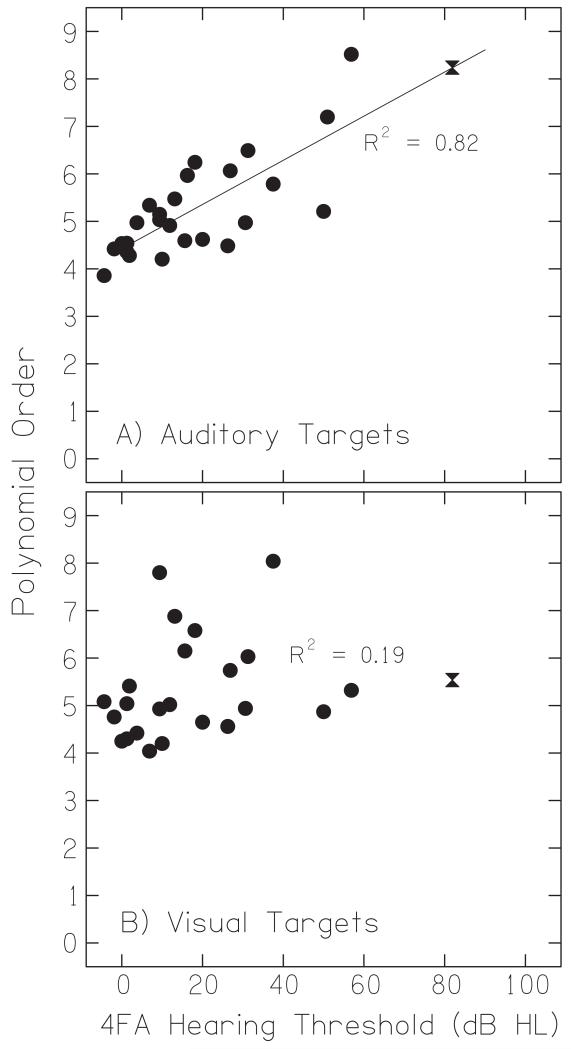
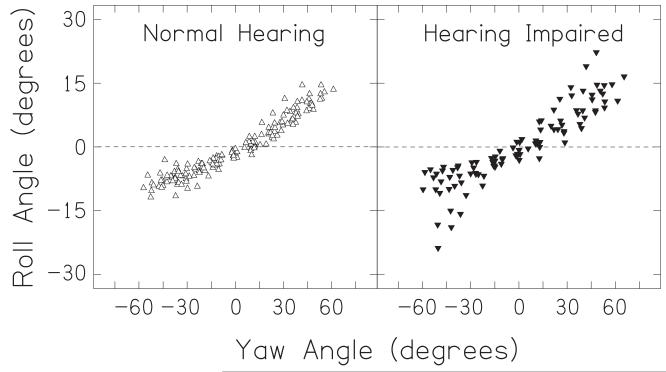
Head movements are intimately involved in sound localization and may provide information that could aid an impaired auditory system. Using an infrared camera system, head position and orientation was measured for 17 normal-hearing and 14 hearing-impaired listeners seated at the center of a ring of loudspeakers. Listeners were asked to orient their heads as quickly as was comfortable toward a sequence of visual targets, or were blindfolded and asked to orient toward a sequence of loudspeakers playing a short sentence. To attempt to elicit natural orienting responses, listeners were not asked to reorient their heads to the 0 degrees loudspeaker between trials. The results demonstrate that hearing-impairment is associated with several changes in orienting responses. Hearing-impaired listeners showed a larger difference in auditory versus visual fixation position and a substantial increase in initial and fixation latency for auditory targets. Peak velocity reached roughly 140 degrees/s in both groups, corresponding to a rate of change of approximately 1 micros of interaural time difference per millisecond of time. Most notably, hearing-impairment was associated with a large change in the complexity of the movement, changing from smooth sigmoidal trajectories to ones characterized by abruptly changing velocities, directional reversals, and frequent fixation angle corrections.


Figures

FIG. 1
FIG. 1
Schematic illustration of the experimental apparatus. (A) The acoustically-treated room showing the 360° loudspeaker ring, the 5 infrared motion-tracking cameras, and the listener’s approximate location in the room. (B) The head-mounted crown including reflective markers. This diagram also depicts the 3 Euler angles (yaw, pitch, and roll) and their respective axes of rotation. The directions of the arrows represent positive angles.
FIG. 2
FIG. 2
A set of example movement trajectories of an individual representative of normal-hearing listeners. All trajectories are in the form of yaw angle as a function of time and represent movements in response to a sentence presented from the 45° loudspeaker. The solid and dashed lines highlight two illustrative trajectories.
FIG. 3
FIG. 3
Group averages for auditory and visual fixation points. Mean fixation angle for all hearing-impaired (A) and normal-hearing (B) listeners in response to auditory (squares) and visual (circles) targets as a function of target loudspeaker angle. Error bars shown are standard error of the mean. The dotted line represents an ‘ideal’ orientation response, namely a fixation angle that precisely matched the target speaker angle.
FIG. 4
FIG. 4
Auditory versus visual fixation differences expressed as RMS error as a function of average hearing-impairment. Listeners whose 0° loudspeaker orientation was artificially centered (open stars), outlying listeners with inconsistent trajectories (open hexagons), and the listener with 82 dB hearing loss (represented by an hourglass in this and all subsequent figures) were not included in the analysis.
FIG. 5
FIG. 5
Peak velocity for auditory and visual targets. The mean peak velocity for all hearing-impaired (squares) and normal-hearing listeners (circles) in response to auditory (A) and visual targets (B) is plotted as a function of jump size. Error bars shown are standard error of the mean. The gap in the x-axis corresponds to the small jumps that were not included in the loudspeaker sequence.
FIG. 6
FIG. 6
Response latencies for auditory and visual targets. Initial latency (A) and fixation latency (B) in response to auditory (squares) and visual targets (circles) is plotted as a function of hearing-loss. Linear regressions for auditory (solid line) and visual targets (dashed line) are plotted in both panels. Data points for the listener with the most severe loss are plotted as hourglass symbols but were not included in the regression.
FIG. 7
FIG. 7
Overshoot counts for auditory targets. (A) The mean number of overshoots as calculated using the criterion of 3.25° is plotted as function of hearing-loss (B) The mean number of overshoots as calculated using the less stringent criterion of 7.5°. The hourglass symbol shows data for the listener with the most severe loss.
FIG. 8
FIG. 8
Trajectory complexity for auditory targets. Mean polynomial order — a quantification of trajectory shape— is plotted as a function of hearing loss for auditory targets (A) and visual targets (B). The hourglass symbol shows data for the listener with the most severe loss.
FIG. 9
FIG. 9
Head roll plotted as a function of head yaw for all listeners. Roll varies as a function of yaw for both normal-hearing (left) and hearing-impaired listeners (right).

References

    1. Akeroyd MA, Gatehouse S, Blaschke J. The detection of differences in the cues to distance by elderly hearing-impaired listeners. J. Acoust. Soc. Am. 2007;121:1077–1089. - PMC - PubMed
    1. Angell JR, Fite W. The Monaural Localization of Sounds. Psychol. Rev. 1901;8:225–246.
    1. Brimijoin WO, O’Neill WE. Measuring Inhibition and Facilitation in the Inferior Colliculus Using Vector-Based Analysis of Spectrotemporal Receptive Fields. Advances and Perspectives in Auditory Neurophysiology (abstracts) 2005;3
    1. Brungart DS, Durlach NI, Rabinowitz WM. Auditory localization of nearby sources. II. Localization of a broadband source. J. Acoust. Soc. Am. 1999;106:1956–1968. - PubMed
    1. de Bruijn NG. A Combinatorial Problem. Koninklijke Nederlandse Akademie v. Wetenschappen. 1946;49:758–764.

Publication types