

MRI assessment of lean and adipose tissue distribution in female patients with Cushing's disease
- PMID: 20550536
- PMCID: PMC2962672
- DOI: 10.1111/j.1365-2265.2010.03829.x
MRI assessment of lean and adipose tissue distribution in female patients with Cushing's disease
Abstract
Objective: Chronic hypercortisolemia due to Cushing's disease (CD) results in abnormal adipose tissue (AT) distribution. Whole-body magnetic resonance imaging (MRI) was used to examine lean and AT distribution in female patients with CD to further understand the role of glucocorticoid excess in the development of abnormal AT distribution and obesity.
Design: Cross-sectional and case-control study.
Patients: Fifteen women with CD and 12 healthy controls.
Measurements: Mass of skeletal muscle (SM) and AT in the visceral (VAT), subcutaneous (SAT), and intermuscular (IMAT) compartments from whole-body MRI and serum levels of insulin, glucose, and leptin were measured.
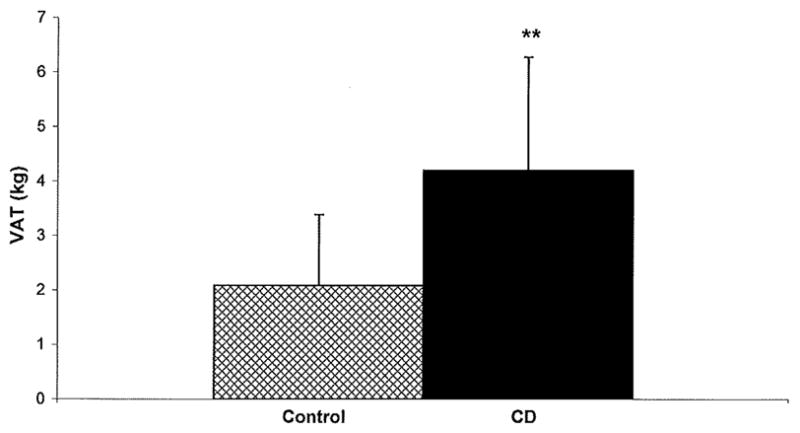
Results: CD patients had leptin values that correlated to total AT (TAT) and SAT (P < 0.05) but not to VAT. CD patients had higher VAT/TAT ratios (P < 0.01) and lower SAT/TAT ratios (P < 0.05) compared to controls. TAT, VAT, and trunk SAT (TrSAT) were greater in CD patients (P < 0.01). SM was less in CD (P < 0.001) but IMAT was not different.
Conclusions: TAT, VAT, trSAT, and the proportion of AT in the visceral depot were greater in CD although the proportion in the subcutaneous depot was less. SM was less but IMAT was not different. These findings have implications for understanding the role of cortisol in the abnormal AT distribution and metabolic risk seen in patients exposed to chronic excess glucocorticoids.
© 2010 Blackwell Publishing Ltd.
Figures
Similar articles
-
Body composition and cardiovascular risk markers after remission of Cushing's disease: a prospective study using whole-body MRI.J Clin Endocrinol Metab. 2012 May;97(5):1702-11. doi: 10.1210/jc.2011-3123. Epub 2012 Mar 14. J Clin Endocrinol Metab. 2012. PMID: 22419708 Free PMC article.
-
Intermuscular adipose tissue and metabolic associations in HIV infection.Obesity (Silver Spring). 2011 Feb;19(2):283-91. doi: 10.1038/oby.2010.115. Epub 2010 Jun 10. Obesity (Silver Spring). 2011. PMID: 20539305 Free PMC article.
-
Lower visceral and subcutaneous but higher intermuscular adipose tissue depots in patients with growth hormone and insulin-like growth factor I excess due to acromegaly.J Clin Endocrinol Metab. 2008 Jun;93(6):2334-43. doi: 10.1210/jc.2007-2780. Epub 2008 Mar 18. J Clin Endocrinol Metab. 2008. PMID: 18349062 Free PMC article.
-
Visceral adiposity and inflammatory bowel disease.Int J Colorectal Dis. 2021 Nov;36(11):2305-2319. doi: 10.1007/s00384-021-03968-w. Epub 2021 Jun 9. Int J Colorectal Dis. 2021. PMID: 34104989 Review.
-
Depot-specific hormonal characteristics of subcutaneous and visceral adipose tissue and their relation to the metabolic syndrome.Horm Metab Res. 2002 Nov-Dec;34(11-12):616-21. doi: 10.1055/s-2002-38256. Horm Metab Res. 2002. PMID: 12660870 Review.
Cited by
-
Muscle-specific downregulation of GR levels inhibits adipogenesis in porcine intramuscular adipocyte tissue.Sci Rep. 2017 Mar 30;7(1):510. doi: 10.1038/s41598-017-00615-9. Sci Rep. 2017. PMID: 28360421 Free PMC article.
-
A novel combined glucocorticoid-mineralocorticoid receptor selective modulator markedly prevents weight gain and fat mass expansion in mice fed a high-fat diet.Int J Obes (Lond). 2016 Jun;40(6):964-72. doi: 10.1038/ijo.2016.13. Epub 2016 Feb 2. Int J Obes (Lond). 2016. PMID: 26830012
-
Managing Cushing's disease: the state of the art.Endocrine. 2014 Sep;47(1):9-20. doi: 10.1007/s12020-013-0129-2. Epub 2014 Jan 11. Endocrine. 2014. PMID: 24415169 Review.
-
Impact of long-term steroid therapy on epicardial and pericardial fat deposition: a cardiac MRI study.Cardiovasc Diabetol. 2015 Sep 30;14:130. doi: 10.1186/s12933-015-0289-x. Cardiovasc Diabetol. 2015. PMID: 26419433 Free PMC article.
-
Depot Dependent Effects of Dexamethasone on Gene Expression in Human Omental and Abdominal Subcutaneous Adipose Tissues from Obese Women.PLoS One. 2016 Dec 22;11(12):e0167337. doi: 10.1371/journal.pone.0167337. eCollection 2016. PLoS One. 2016. PMID: 28005982 Free PMC article.
References
-
- Mayo-Smith W, Hayes CW, Biller BM, Klibanski A, Rosenthal H, Rosenthal DI. Body fat distribution measured with CT: correlations in healthy subjects, patients with anorexia nervosa, and patients with Cushing syndrome. Radiology. 1989;170:515–518. - PubMed
-
- Rebuffe-Scrive M, Krotkiewski M, Elfverson J, Bjorntorp P. Muscle and adipose tissue morphology and metabolism in Cushing’s syndrome. J Clin Endocrinol Metab. 1988;67:1122–1128. - PubMed
-
- Rebuffe-Scrive M, Lundholm K, Bjorntorp P. Glucocorticoid hormone binding to human adipose tissue. Eur J Clin Invest. 1985;15:267–271. - PubMed
-
- Rebuffe-Scrive M, Bronnegard M, Nilsson A, Eldh J, Gustafsson JA, Bjorntorp P. Steroid hormone receptors in human adipose tissues. J Clin Endocrinol Metab. 1990;71:1215–1219. - PubMed
-
- Burt MG, Gibney J, Ho KK. Characterization of the metabolic phenotypes of Cushing’s syndrome and growth hormone deficiency: a study of body composition and energy metabolism. Clin Endocrinol (Oxf) 2006;64:436–443. - PubMed
Publication types
MeSH terms
Substances
Grants and funding
LinkOut - more resources
Full Text Sources
Medical
Research Materials
