

Spatial mapping of the biomechanical properties of the pericellular matrix of articular cartilage measured in situ via atomic force microscopy
- PMID: 20550897
- PMCID: PMC2884253
- DOI: 10.1016/j.bpj.2010.03.037
Spatial mapping of the biomechanical properties of the pericellular matrix of articular cartilage measured in situ via atomic force microscopy
Abstract
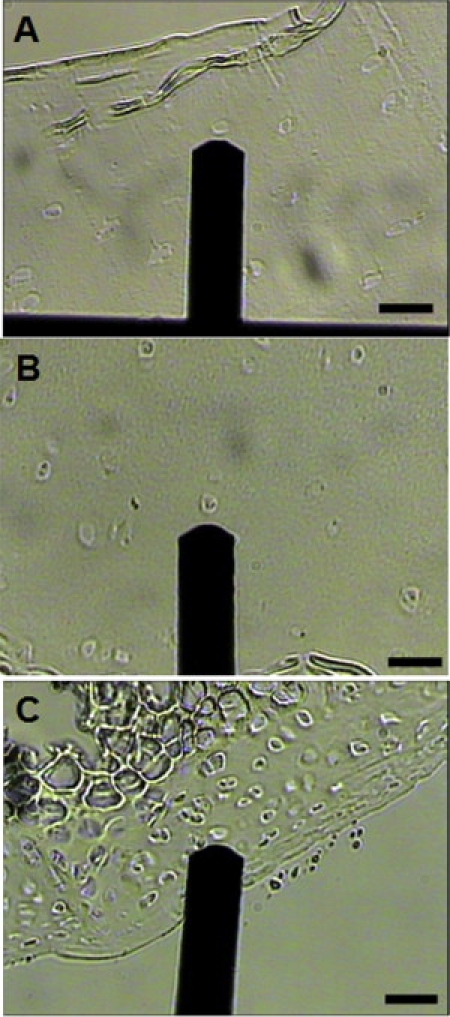
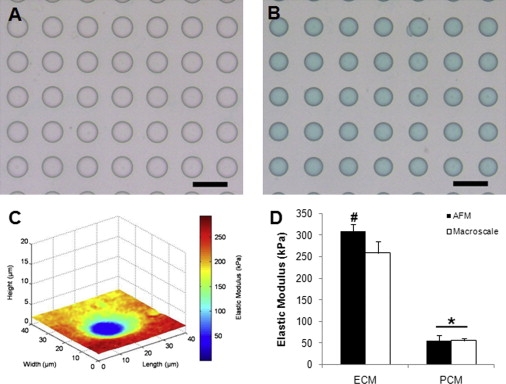
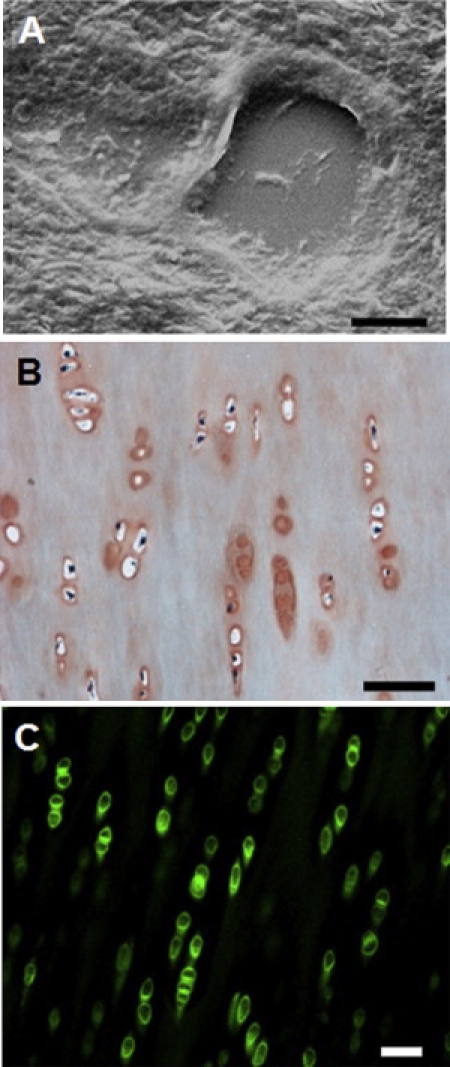
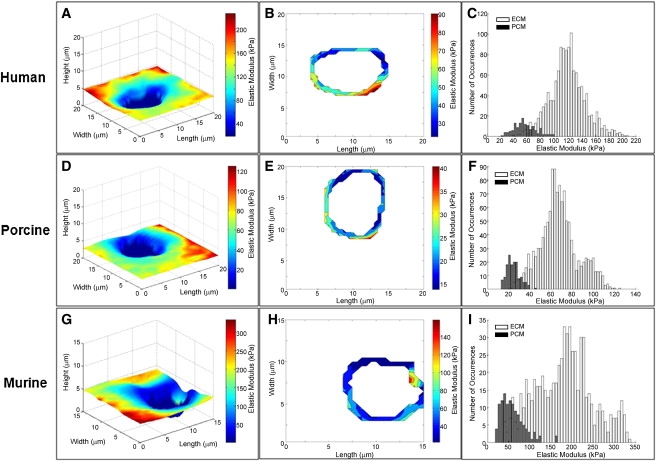
In articular cartilage, chondrocytes are surrounded by a narrow region called the pericellular matrix (PCM), which is biochemically, structurally, and mechanically distinct from the bulk extracellular matrix (ECM). Although multiple techniques have been used to measure the mechanical properties of the PCM using isolated chondrons (the PCM with enclosed cells), few studies have measured the biomechanical properties of the PCM in situ. The objective of this study was to quantify the in situ mechanical properties of the PCM and ECM of human, porcine, and murine articular cartilage using atomic force microscopy (AFM). Microscale elastic moduli were quantitatively measured for a region of interest using stiffness mapping, or force-volume mapping, via AFM. This technique was first validated by means of elastomeric models (polyacrylamide or polydimethylsiloxane) of a soft inclusion surrounded by a stiff medium. The elastic properties of the PCM were evaluated for regions surrounding cell voids in the middle/deep zone of sectioned articular cartilage samples. ECM elastic properties were evaluated in regions visually devoid of PCM. Stiffness mapping successfully depicted the spatial arrangement of moduli in both model and cartilage surfaces. The modulus of the PCM was significantly lower than that of the ECM in human, porcine, and murine articular cartilage, with a ratio of PCM to ECM properties of approximately 0.35 for all species. These findings are consistent with previous studies of mechanically isolated chondrons, and suggest that stiffness mapping via AFM can provide a means of determining microscale inhomogeneities in the mechanical properties of articular cartilage in situ.
(c) 2010 Biophysical Society. Published by Elsevier Inc. All rights reserved.
Figures
References
-
- Poole C.A., Flint M.H., Beaumont B.W. Chondrons in cartilage: ultrastructural analysis of the pericellular microenvironment in adult human articular cartilages. J. Orthop. Res. 1987;5:509–522. - PubMed
-
- Hunziker E.B., Michel M., Studer D. Ultrastructure of adult human articular cartilage matrix after cryotechnical processing. Microsc. Res. Tech. 1997;37:271–284. - PubMed
-
- Alexopoulos L.G., Haider M.A., Guilak F. Alterations in the mechanical properties of the human chondrocyte pericellular matrix with osteoarthritis. J. Biomech. Eng. 2003;125:323–333. - PubMed
-
- Szirmai J.A. The concept of the chondron as a biomechanical unit. In: Hartmann F., editor. Biopolymer und Biomechanik von Bindegewebssystemen. Academic Press; Berlin: 1974. p. 87.
Publication types
MeSH terms
Substances
Grants and funding
- AG15768/AG/NIA NIH HHS/United States
- R01 AR048852/AR/NIAMS NIH HHS/United States
- F32 AR053448/AR/NIAMS NIH HHS/United States
- R01 AR048182/AR/NIAMS NIH HHS/United States
- K99 AR054673/AR/NIAMS NIH HHS/United States
- T32 EB001630/EB/NIBIB NIH HHS/United States
- AR48852/AR/NIAMS NIH HHS/United States
- R01 EB009643/EB/NIBIB NIH HHS/United States
- EB01630/EB/NIBIB NIH HHS/United States
- R00 AR054673/AR/NIAMS NIH HHS/United States
- EB09643/EB/NIBIB NIH HHS/United States
- AR50245/AR/NIAMS NIH HHS/United States
- P01 AR050245/AR/NIAMS NIH HHS/United States
- R01 AG015768/AG/NIA NIH HHS/United States
- AR53448/AR/NIAMS NIH HHS/United States
- AR48182/AR/NIAMS NIH HHS/United States
LinkOut - more resources
Full Text Sources
Other Literature Sources
Miscellaneous
