. 2010 Jun 16;98(12):2857-66.
doi: 10.1016/j.bpj.2010.03.031.

Down-state model of the voltage-sensing domain of a potassium channel

Affiliations

Down-state model of the voltage-sensing domain of a potassium channel

Eric V Schow et al. Biophys J. .

Abstract

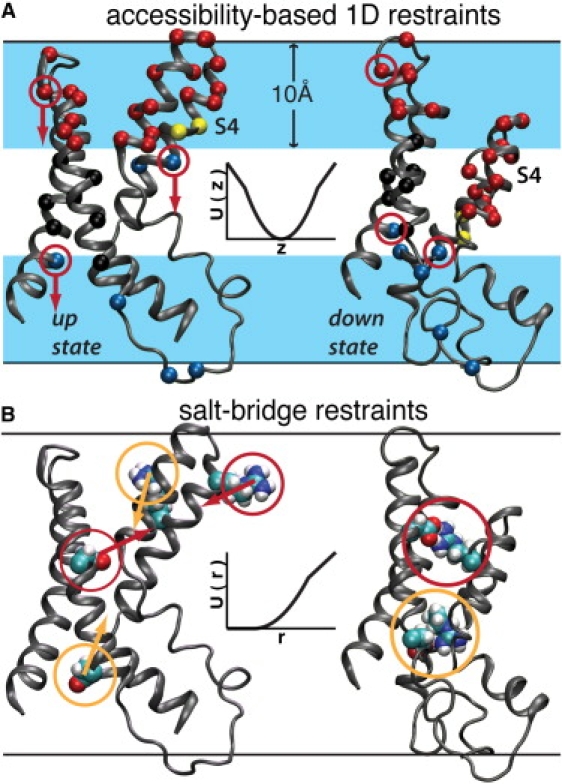
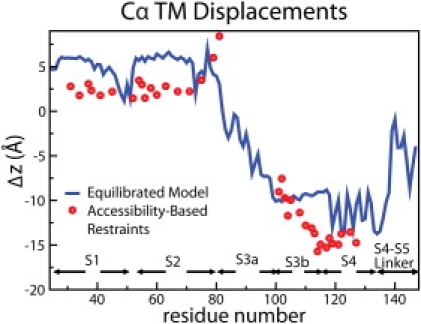
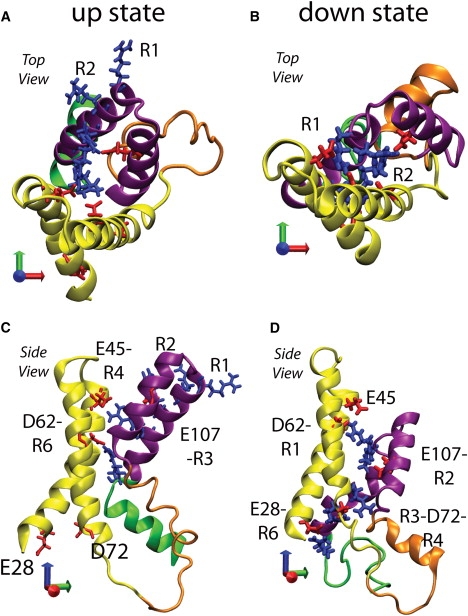
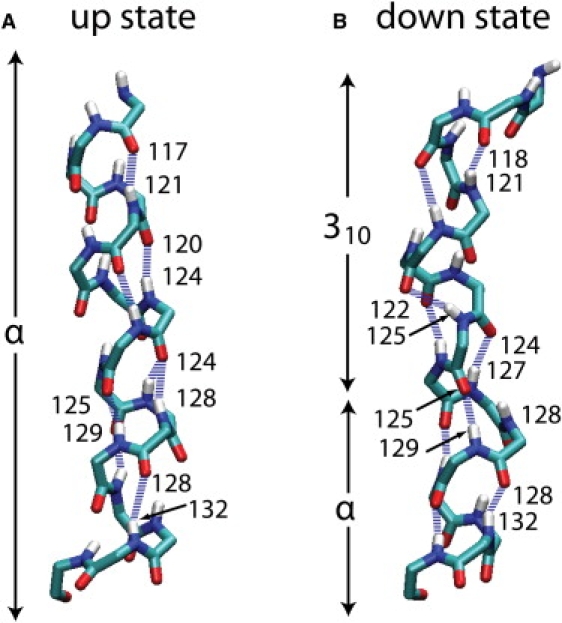
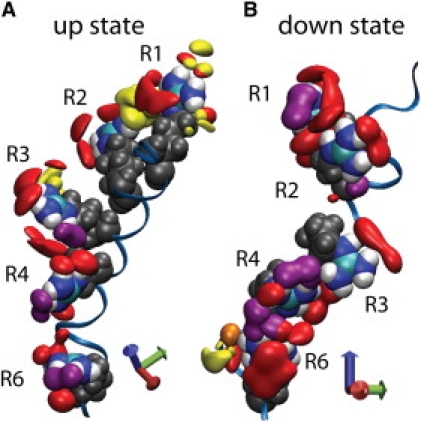
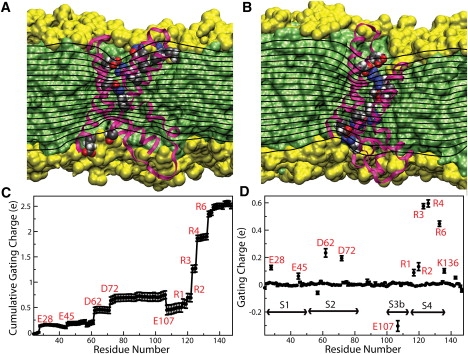
Voltage-sensing domains (VSDs) of voltage-gated potassium (Kv) channels undergo a series of conformational changes upon membrane depolarization, from a down state when the channel is at rest to an up state, all of which lead to the opening of the channel pore. The crystal structures reported to date reveal the pore in an open state and the VSDs in an up state. To gain insights into the structure of the down state, we used a set of experiment-based restraints to generate a model of the down state of the KvAP VSD using molecular-dynamics simulations of the VSD in a lipid bilayer in excess water. The equilibrated VSD configuration is consistent with the biotin-avidin accessibility and internal salt-bridge data used to generate it, and with additional biotin-avidin accessibility data. In the model, both the S3b and S4 segments are displaced approximately 10 A toward the intracellular side with respect to the up-state configuration, but they do not move as a rigid body. Arginine side chains that carry the majority of the gating charge also make large excursions between the up and down states. In both states, arginines interact with water and participate in salt bridges with acidic residues and lipid phosphate groups. An important feature that emerges from the down-state model is that the N-terminal half of the S4 segment adopts a 3(10)-helical conformation, which appears to be necessary to satisfy a complex salt-bridge network.


Figures

Figure 1
Figure 1
MD restraint definitions used to generate the down-state model. In both panels, the pairs of VSD structures correspond to a configuration from the end of a simulation of the isolated voltage sensor (53) based on the structural model reported by Lee et al. (7) and to the down-state configuration taken from the end of the unrestrained trajectory reported here. The pair of black horizontal lines represents the location of the lipid bilayer interface. (A) Ruta et al. (10) used biotinylated cysteine substitutions throughout the VSD to measure the accessibility of avidin to biotin tethers of three different lengths to map the TM depths of the labeled residues. We used these data as one-dimensional position restraints on the corresponding 36 Cα atoms (shown here as spheres). The atom coloring scheme corresponds to the reported biotin-avdin accessibility for a tether length of 10 Å. Red indicates accessibility to extracellular avidin, blue is intracellular, yellow is both intra- and extracellular, and black indicates inaccessibility to avidin. The light-blue band represents a depth of 10 Å into the hydrocarbon core. (B) Three-dimensional distance restraints were applied to form salt bridges between R117-D62 and R123-D72, based on experimental evidence discussed in detail in the Supporting Material. The insets in A and B illustrate the form of the corresponding restraint potentials. The arrows represent the directions of the restraint forces.
Figure 2
Figure 2
Quantitative comparison of the biotin-avidin accessibility constraints to the down-state unrestrained simulation. The blue line indicates the difference between the mean position of the Cα atoms in our equilibrated up- and down-state trajectories (last 16 and 35 ns, respectively). The red dots indicate the difference between the mean position of the Cα atoms in our equilibrated up state and the locations assigned by Ruta et al. (10) for the VSD in the down state, i.e., the initial constraints used to generate the model.
Figure 3
Figure 3
Structural comparison of the VSD up- and down-state configurations. S1 and S2 are yellow, S3a is orange, S3b and S4 are purple, and the S4-S5 linker is green. The S4 arginines (blue) and key acidic residues (red) are shown in licorice representation, and salt bridges between them are labeled. The blue axis indicates the TM direction. (A and C) Top and side views of the starting up state. (B and D) Top and side views of the down-state model. S3b and S4 are displaced ∼10 Å in the down state relative to the up state. In the up-state configuration, S3b–S4 are projected away from the rest of the helices, and R1 and R2 face away from the VSD interior. In the down-state configuration, S4 has changed secondary structure, and all of the S4 arginines face inward and are forming salt bridges with acidic residues.
Figure 4
Figure 4
Backbone hydrogen-bond configuration of the S4 segment in the up and down states. (A) Up-state configuration showing that S4 is α-helical from R117 to G134. (B) Down-state configuration showing that the S3b–S4 turn extends to L118, and that S4 is a 310-helix from V119 to I127, and α-helical from L128 to R133. An N-O distance ≤ 4 Å and an N-H-O angle ≥ 150° were used as backbone hydrogen-bonding criteria.
Figure 5
Figure 5
VSD solvation in the up (A) and down (B) states. Solvation of arginine residues in the S4 segment is described by isodensity surfaces of oxygen atoms forming the first coordination shell of the guanidinium moieties. Solvation by water oxygens is shown in red, lipid phosphate oxygens in yellow, and acidic chain carboxyl oxygens in purple. The blue axis indicates the TM direction.
Figure 6
Figure 6
Electrostatic properties of the VSD in the up and down states. Panels A and B show equipotential surfaces for the up and down states, respectively, by means of a slice through the center of the VSD. See the Supporting Material for details of the calculation of the equipotential surfaces. In both states, the electrostatic potential exhibits focusing features in the VSD cavities that suggest that charges could be displaced across the membrane electric field over a region that is 65–75% of the membrane thickness. Contributions to the molecular surface by aliphatic chains and polar groups are shown in green and yellow, respectively. The corresponding cutaway views are shown as background. The S4 arginines and their corresponding acidic partners are shown in space-filling representation using van der Waals radii and colored by atom name. (C) Cumulative gating charge. The total charge displaced between the up- and down-state configurations is 2.51 ± 0.05 e. (D) Gating charge as a function of residue position. The S4 arginines account for 73% of the total gating charge. The electrostatic potential was averaged over 340 configurations of the down-state simulation and 160 configurations of the up-state simulation, taken every 100 ps. Error bars in the gating charge calculation correspond to one standard deviation.

Similar articles

Cited by

References

    1. Hille B. Sinauer Associates, Inc.; Sunderland, MA: 2001. Ion Channels of Excitable Membranes.
    1. MacKinnon R., Aldrich R.W., Lee A.W. Functional stoichiometry of Shaker potassium channel inactivation. Science. 1993;262:757–759. - PubMed
    1. Jiang Y.X., Lee A., MacKinnon R. X-ray structure of a voltage-dependent K+ channel. Nature. 2003;423:33–41. - PubMed
    1. Bezanilla F. The voltage sensor in voltage-dependent ion channels. Physiol. Rev. 2000;80:555–592. - PubMed
    1. Tombola F., Pathak M.M., Isacoff E.Y. How does voltage open an ion channel? Annu. Rev. Cell Dev. Biol. 2006;22:23–52. - PubMed

Publication types

MeSH terms