

A two-step path to inclusion formation of huntingtin peptides revealed by number and brightness analysis
- PMID: 20550921
- PMCID: PMC2884247
- DOI: 10.1016/j.bpj.2010.02.058
A two-step path to inclusion formation of huntingtin peptides revealed by number and brightness analysis
Abstract
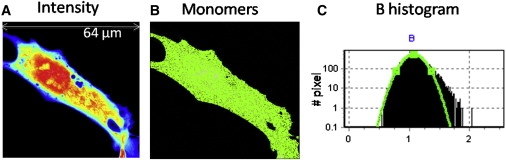
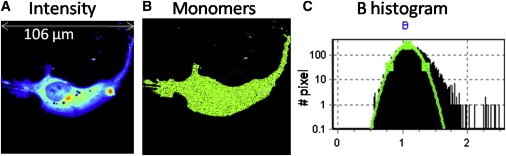
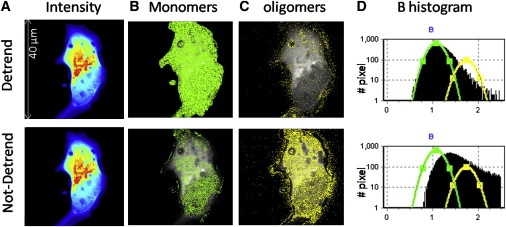
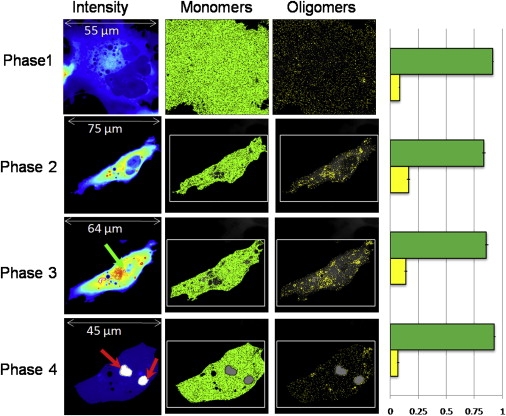
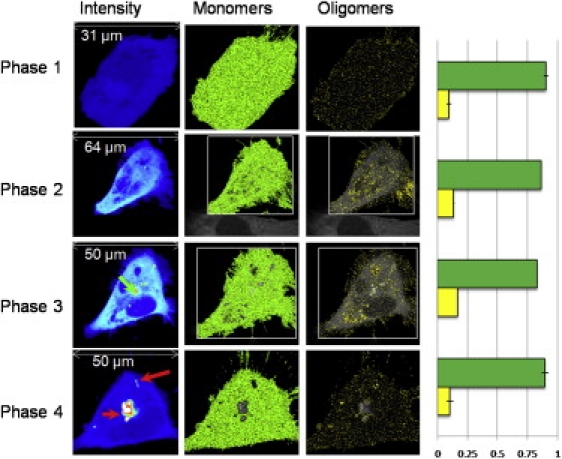
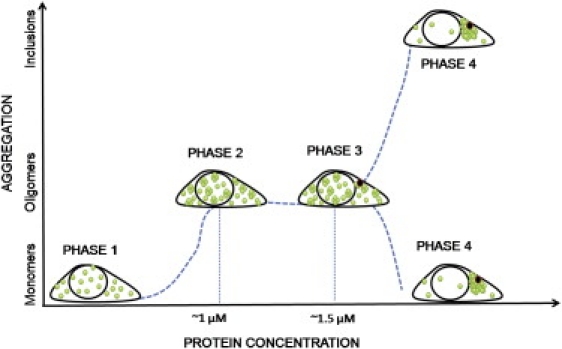
Protein aggregation is a hallmark of several neurodegenerative diseases including Huntington's disease. We describe the use of the recently developed number and brightness method (N&B) that uses confocal images to monitor aggregation of Huntingtin exon 1 protein (Httex1p) directly in living cells. N&B measures the molecular brightness of protein aggregates in the entire cell noninvasively based on intensity fluctuations at each pixel in an image. N&B applied to mutant Httex1p in living cells showed a two-step pathway leading to inclusion formation that is polyQ length dependent and involves four phases. An initial phase of monomer accumulation is followed by formation of small oligomers (5-15 proteins); as protein concentration increases, an inclusion is seeded and forms in the cytoplasm; the growing inclusion recruits most of the Httex1p and depletes the cell leaving only a low concentration of monomers. The behavior of Httex1p in COS-7 and ST14A cells is compared.
(c) 2010 Biophysical Society. Published by Elsevier Inc. All rights reserved.
Figures
Similar articles
-
Soluble polyglutamine oligomers formed prior to inclusion body formation are cytotoxic.Hum Mol Genet. 2008 Feb 1;17(3):345-56. doi: 10.1093/hmg/ddm311. Epub 2007 Oct 18. Hum Mol Genet. 2008. PMID: 17947294
-
A cellular model that recapitulates major pathogenic steps of Huntington's disease.Hum Mol Genet. 1998 Sep;7(9):1355-61. doi: 10.1093/hmg/7.9.1355. Hum Mol Genet. 1998. PMID: 9700187
-
Decreased cAMP response element-mediated transcription: an early event in exon 1 and full-length cell models of Huntington's disease that contributes to polyglutamine pathogenesis.J Biol Chem. 2004 Feb 6;279(6):4988-99. doi: 10.1074/jbc.M310226200. Epub 2003 Nov 18. J Biol Chem. 2004. PMID: 14627700
-
Protein aggregation in Huntington's disease.Biochimie. 2002 Apr;84(4):273-8. doi: 10.1016/s0300-9084(02)01398-6. Biochimie. 2002. PMID: 12106904 Review.
-
The emerging role of the first 17 amino acids of huntingtin in Huntington's disease.Biomol Concepts. 2015 Mar;6(1):33-46. doi: 10.1515/bmc-2015-0001. Biomol Concepts. 2015. PMID: 25741791 Free PMC article. Review.
Cited by
-
Tracking protein aggregation and mislocalization in cells with flow cytometry.Nat Methods. 2012 Mar 18;9(5):467-70. doi: 10.1038/nmeth.1930. Nat Methods. 2012. PMID: 22426490
-
Dynamic Mode Decomposition of Fluorescence Loss in Photobleaching Microscopy Data for Model-Free Analysis of Protein Transport and Aggregation in Living Cells.Sensors (Basel). 2022 Jun 23;22(13):4731. doi: 10.3390/s22134731. Sensors (Basel). 2022. PMID: 35808232 Free PMC article.
-
Backbone Engineering within a Latent β-Hairpin Structure to Design Inhibitors of Polyglutamine Amyloid Formation.J Mol Biol. 2017 Jan 20;429(2):308-323. doi: 10.1016/j.jmb.2016.12.010. Epub 2016 Dec 13. J Mol Biol. 2017. PMID: 27986569 Free PMC article.
-
Supramolecular non-amyloid intermediates in the early stages of α-synuclein aggregation.Biophys J. 2012 Mar 7;102(5):1127-36. doi: 10.1016/j.bpj.2012.01.051. Epub 2012 Mar 6. Biophys J. 2012. PMID: 22404935 Free PMC article.
-
Number and brightness analysis of sFRP4 domains in live cells demonstrates vesicle association signal of the NLD domain and dynamic intracellular responses to Wnt3a.Int J Biochem Cell Biol. 2015 Jul;64:91-6. doi: 10.1016/j.biocel.2015.03.010. Epub 2015 Mar 21. Int J Biochem Cell Biol. 2015. PMID: 25805505 Free PMC article.
References
-
- Bates G. Huntingtin aggregation and toxicity in Huntington's disease. Lancet. 2003;361:1642–1644. - PubMed
-
- Marsh J.L., Walker H., Thompson L.M. Expanded polyglutamine peptides alone are intrinsically cytotoxic and cause neurodegeneration in Drosophila. Hum. Mol. Genet. 2000;9:13–25. - PubMed
-
- Davies S.W., Turmaine M., Bates G.P. Formation of neuronal intranuclear inclusions underlies the neurological dysfunction in mice transgenic for the HD mutation. Cell. 1997;90:537–548. - PubMed
-
- DiFiglia M., Sapp E., Aronin N. Aggregation of huntingtin in neuronal intranuclear inclusions and dystrophic neurites in brain. Science. 1997;277:1990–1993. - PubMed
-
- Ordway J.M., Tallaksen-Greene S., Detloff P.J. Ectopically expressed CAG repeats cause intranuclear inclusions and a progressive late onset neurological phenotype in the mouse. Cell. 1997;91:753–763. - PubMed
Publication types
MeSH terms
Substances
Grants and funding
LinkOut - more resources
Full Text Sources
Other Literature Sources
