

Fluorescence spectral dynamics of single LHCII trimers
- PMID: 20550923
- PMCID: PMC2884258
- DOI: 10.1016/j.bpj.2010.03.028
Fluorescence spectral dynamics of single LHCII trimers
Abstract
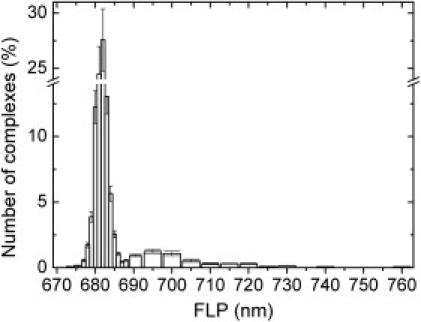
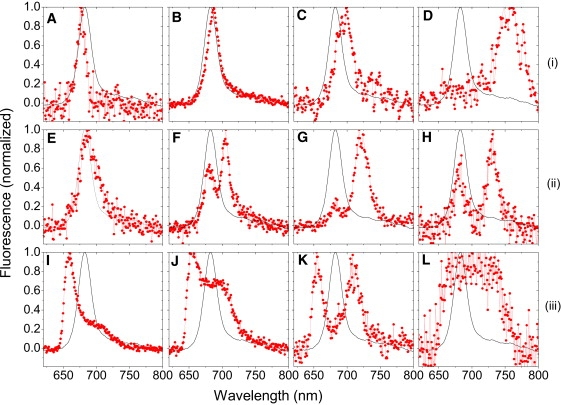
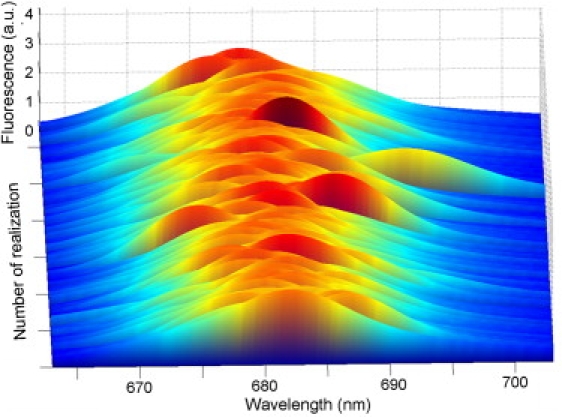
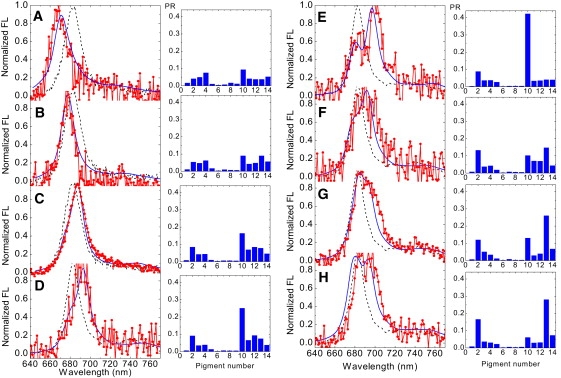
Single-molecule spectroscopy was employed to elucidate the fluorescence spectral heterogeneity and dynamics of individual, immobilized trimeric complexes of the main light-harvesting complex of plants in solution near room temperature. Rapid reversible spectral shifts between various emitting states, each of which was quasi-stable for seconds to tens of seconds, were observed for a fraction of the complexes. Most deviating states were characterized by the appearance of an additional, red-shifted emission band. Reversible shifts of up to 75 nm were detected. By combining modified Redfield theory with a disordered exciton model, fluorescence spectra with peaks between 670 nm and 705 nm could be explained by changes in the realization of the static disorder of the pigment-site energies. Spectral bands beyond this wavelength window suggest the presence of special protein conformations. We attribute the large red shifts to the mixing of an excitonic state with a charge-transfer state in two or more strongly coupled chlorophylls. Spectral bluing is explained by the formation of an energy trap before excitation energy equilibration is completed.
(c) 2010 Biophysical Society. Published by Elsevier Inc. All rights reserved.
Figures

Similar articles
-
Fluorescence spectral fluctuations of single LH2 complexes from Rhodopseudomonas acidophila strain 10050.Biochemistry. 2004 Apr 20;43(15):4431-8. doi: 10.1021/bi0497648. Biochemistry. 2004. PMID: 15078088
-
The specificity of controlled protein disorder in the photoprotection of plants.Biophys J. 2013 Aug 20;105(4):1018-26. doi: 10.1016/j.bpj.2013.07.014. Biophys J. 2013. PMID: 23972853 Free PMC article.
-
Characterization of fluorescent chlorophyll charge-transfer states as intermediates in the excited state quenching of light-harvesting complex II.Photosynth Res. 2020 May;144(2):171-193. doi: 10.1007/s11120-020-00745-8. Epub 2020 Apr 20. Photosynth Res. 2020. PMID: 32307623
-
How the molecular structure determines the flow of excitation energy in plant light-harvesting complex II.J Plant Physiol. 2011 Aug 15;168(12):1497-509. doi: 10.1016/j.jplph.2011.01.004. Epub 2011 Feb 16. J Plant Physiol. 2011. PMID: 21330003
-
Theory of excitation energy transfer: from structure to function.Photosynth Res. 2009 Nov-Dec;102(2-3):471-85. doi: 10.1007/s11120-009-9472-9. Photosynth Res. 2009. PMID: 19653118 Review.
Cited by
-
High-Throughput Single-Molecule Spectroscopy Resolves the Conformational Isomers of BODIPY Chromophores.J Phys Chem Lett. 2019 Nov 7;10(21):6807-6812. doi: 10.1021/acs.jpclett.9b02250. Epub 2019 Oct 21. J Phys Chem Lett. 2019. PMID: 31622551 Free PMC article.
-
Charge transfer from the carotenoid can quench chlorophyll excitation in antenna complexes of plants.Nat Commun. 2020 Jan 31;11(1):662. doi: 10.1038/s41467-020-14488-6. Nat Commun. 2020. PMID: 32005811 Free PMC article.
-
Contribution of low-temperature single-molecule techniques to structural issues of pigment-protein complexes from photosynthetic purple bacteria.J R Soc Interface. 2018 Jan;15(138):20170680. doi: 10.1098/rsif.2017.0680. J R Soc Interface. 2018. PMID: 29321265 Free PMC article. Review.
-
Light-harvesting regulation from leaf to molecule with the emphasis on rapid changes in antenna size.Photosynth Res. 2015 May;124(2):137-58. doi: 10.1007/s11120-015-0115-z. Epub 2015 Mar 14. Photosynth Res. 2015. PMID: 25773873 Review.
-
Preprocess dependence of optical properties of ensembles and single siphonaxanthin-containing major antenna from the marine green alga Codium fragile.Sci Rep. 2022 May 19;12(1):8461. doi: 10.1038/s41598-022-11572-3. Sci Rep. 2022. PMID: 35589761 Free PMC article.
References
-
- Kühlbrandt W., Wang D.N., Fujiyoshi Y. Atomic model of plant light-harvesting complex by electron crystallography. Nature. 1994;367:614–621. - PubMed
-
- Liu Z.F., Yan H.C., Chang W. Crystal structure of spinach major light-harvesting complex at 2.72 A resolution. Nature. 2004;428:287–292. - PubMed
-
- Van Grondelle R., Dekker J.P., Sundström V. Energy transfer and trapping in photosynthesis. Biochim. Biophys. Acta. 1994;1187:1–65.
-
- Dekker J.P., Boekema E.J. Supramolecular organization of thylakoid membrane proteins in green plants. Biochim. Biophys. Acta. 2005;1706:12–39. - PubMed
-
- Van Amerongen H., van Grondelle R. Understanding the energy transfer function of LHCII, the major light-harvesting complex of green plants. J. Phys. Chem. B. 2001;105:604–617.
Publication types
MeSH terms
Substances
LinkOut - more resources
Full Text Sources
