. 2010 Jun 11;141(6):982-93.
doi: 10.1016/j.cell.2010.05.018.

Helix unwinding and base flipping enable human MTERF1 to terminate mitochondrial transcription

Affiliations

Helix unwinding and base flipping enable human MTERF1 to terminate mitochondrial transcription

Elena Yakubovskaya et al. Cell. .

Abstract

Defects in mitochondrial gene expression are associated with aging and disease. Mterf proteins have been implicated in modulating transcription, replication and protein synthesis. We have solved the structure of a member of this family, the human mitochondrial transcriptional terminator MTERF1, bound to dsDNA containing the termination sequence. The structure indicates that upon sequence recognition MTERF1 unwinds the DNA molecule, promoting eversion of three nucleotides. Base flipping is critical for stable binding and transcriptional termination. Additional structural and biochemical results provide insight into the DNA binding mechanism and explain how MTERF1 recognizes its target sequence. Finally, we have demonstrated that the mitochondrial pathogenic G3249A and G3244A mutations interfere with key interactions for sequence recognition, eliminating termination. Our results provide insight into the role of mterf proteins and suggest a link between mitochondrial disease and the regulation of mitochondrial transcription.


Figures

Figure 1
Figure 1. MTERF1 is a modular protein
A. Amino acid alignment of MTERF1 proteins in different species. Invariant residues are white over a black background. Conserved residues are bold. The numbering corresponds to human MTERF1. Asterisks indicate residues that stack with everted nucleotides and dots indicate residues involved in sequence recognition. Horizontal black bars represent α-helices and dotted lines represent 310 helices. Hs, homo sapiens; fc, felis catus; ss, sus scrofa; ec, equus caballus; bt, bos taurus; mm, mus musculus; rn, rattus norvegicus; oa, ornithorhynchus anatinus; dr, danio rerio. B. Overview of the MTERF1 fold. The structure is shown in the absence of DNA. Mterf motifs are color coded as in A. C. Overlay of the 8 mterf motifs. The rmsd between the first (transparent red, ribbon representation) and each of the other repeats ranges between 1.0 and 3.3 Å for 24 C- atoms (the average is 2.5 Å). Each repeat is color coded as in B. D. Hydrophobic interactions stabilize each mterf repeat. The second mterf motif is shown in ribbon representation. The hydrophobic residues are shown in ball-and-stick representation with their Van der Waals surface in yellow. See also Figure 1S.
Figure 2
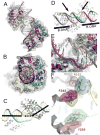
Figure 2. A unique DNA binding mode
A. Global view of the protein-DNA interaction. Each repeated mterf motif is colored as in Figure 1. The light strand is brown and the heavy strand is gray. The molecular surface is rendered transparent. B. A 90° rotation of the view in A. C. MTERF1 induces a 25 bend in the DNA molecule. The light strand is green and the heavy strand is yellow. D. MTERF1 unwinds the DNA double-helix. Overlay between the DNA observed in the crystal structure (the heavy and light strands are green and yellow, respectively) and ideal B-form DNA (magenta and blue). The ends of the DNA molecule adopt B conformation (black bars). The central part of the molecule (black arrows) is unwound. E. Three nucleotides (yellow in the figure; corresponding to A3243 of the light strand and T3243 and C3242 of the heavy strand) are everted from the double-helix in the central part of the structure. A simulated annealing fo-fc electron density map is shown contoured at 3σ. F. The three everted nucleotides are stabilized by π-stacking interactions. R162 (orange), F234 (magenta) and Y288 (red) stack against each of the everted nucleotides (color coded as in B). The light strand is green and the heavy strand yellow.
Figure 3
Figure 3. Interactions of MTERF1 with DNA
A. Scheme of the interactions between MTERF1 and the double-stranded DNA. Each interaction is listed with an arrow pointing either to the phosphate or to a DNA base. The three everted nucleotides and the residues that stack with them are colored. The five arginine residues that determine sequence specificity are shown in blue. W indicates a water mediated interaction. B. Overlay of C-α traces of WT (yellow) and triple mutant (magenta) structures. The DNA backbone is also shown for each of the DNA strands. The WT light and heavy strands are colored red and orange, respectively. The mutant DNA strands are colored green (light) and blue (heavy). C. Overlay of the central part of the DNA duplex in the WT and mutant structures. The three nucleotides that are everted in the WT structure are shown. The mutant heavy strand is blue, while the light strand is green. A simulated-annealing fo-fc omit electron density map is shown, contoured at 3σ. The DNA in the WT structure is shown as a reference. The WT heavy strand is shown in brown while the light strand is magenta. Black arrows indicate the changes in the position of the everted nucleotides that are observed upon mutation of the three stacking residues. D. Electrostatic surface potential of MTERF1. The protein surface is shown, colored between −10 kT e−1 (red) and 10 kT e−1 (blue). The DNA backbone is shown in yellow (light strand) and green (heavy strand). E. Sequence recognition by arginine residues. Five arginine residues determine sequence recognition by MTERF1. A representative example showing how R169 and R202 interact with their partner guanine residues. The R202 interaction is atypical in that only one hydrogen bond is established with the guanine base. Hydrogen-bonding distances are shown in orange. A simulated annealing fo-fc electron density map is shown contoured at 4σ. See also Figure 2S.
Figure 4
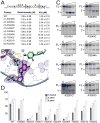
Figure 4. DNA binding measurements
ITC data from the titration of the leu-tRNA MTERF1 binding sequence into wt MTERF1 (A), the triple R162A-F243A-Y288A mutant (B) or the R387A mutant (C). D. Summary of the observed binding constants. The sequence of each substrate (one of the strands) is indicated at the top of the table. See also Figure 3S.
Figure 5
Figure 5. Termination activity of WT and mutant MTERF1
A. In vitro termination activity. WT MTERF1 and the different mutants were assayed for their ability to terminate transcription from the HSP promoter in vitro (see Experimental Procedures). The termination sequence was cloned in either the forward (A) or reverse orientation (B). The results are equivalent on both orientations and show clear termination for wt MTERF1 but only residual termination for the triple (RFY) mutant and the R387A mutation. FL, full-length run-off transcription. T, termination product. C, control lane without MTERF1. C. Quantification of the termination activity. The bar graph shows the percent termination observed in in vitro termination experiments with the termination sequence in the reverse orientation. Values correspond to the mean ± SD of at least three independent experiments. D. Termination activity of the remaining arginine mutants. E. Model depicting the events leading to specific DNA binding by MTERF1 (represented as a yellow oval).
Figure 6
Figure 6. Pathogenic DNA mutations in the mitochondrial termination sequence
A. Scheme indicating the location of the mutations in the termination sequence and binding constants for titrations of a 22 bp oligonucleotide containing the leu-tRNA MTERF1 binding sequence carrying each of the pathogenic mutations into wt MTERF1. The DNA residues involved in arginine guanine interactions with MTERF1 are indicated by an asterisk. B. Interaction of R387 with G3249. Hydrogen-bonding distances are shown in orange. A simulated annealing fo-fc electron density map is shown (blue) contoured at 4σ. C. In vitro termination activity of wt MTERF1 on substrates containing each of the nine pathogenic mutations. FL, full-length run-off transcription. T, termination product. C, control lane without MTERF1. D. Quantification of termination activity on the different mutant sequences. The bar graph shows the percent termination observed in in vitro termination experiments with the termination sequence in the reverse orientation. Values correspond to the mean ± SD of at least three independent experiments.

Comment in

Similar articles

Cited by

References

    1. Anderson S, Bankier AT, Barrell BG, et al. Sequence and organization of the human mitochondrial genome. Nature. 1981;290:457–465. - PubMed
    1. Asin-Cayuela J, Schwend T, Farge G, Gustafsson CM. The human mitochondrial transcription termination factor (mTERF) is fully active in vitro in the non-phosphorylated form. J Biol Chem. 2005;280:25499–25505. - PubMed
    1. Asin-Cayuela J, Gustafsson CM. Mitochondrial transcription and its regulation in mammalian cells. Trends Biochem Sci. 2007;32:111–117. - PubMed
    1. Chomyn A, Martinuzzi A, Yoneda M, et al. MELAS mutation in mtDNA binding site for transcription termination factor causes defects in protein synthesis and in respiration but no change in levels of upstream and downstream mature transcripts. Proc Natl Acad Sci USA. 1992;89:4221–4225. - PMC - PubMed
    1. Cowtan K. Joint CCP4 and ESF-EACMB Newsletter on Protein. Crystallography. 1994;31:34–38.

Publication types

MeSH terms