

Cyclic AMP suppression is sufficient to induce gliomagenesis in a mouse model of neurofibromatosis-1
- PMID: 20551058
- PMCID: PMC2905483
- DOI: 10.1158/0008-5472.CAN-09-3769
Cyclic AMP suppression is sufficient to induce gliomagenesis in a mouse model of neurofibromatosis-1
Abstract
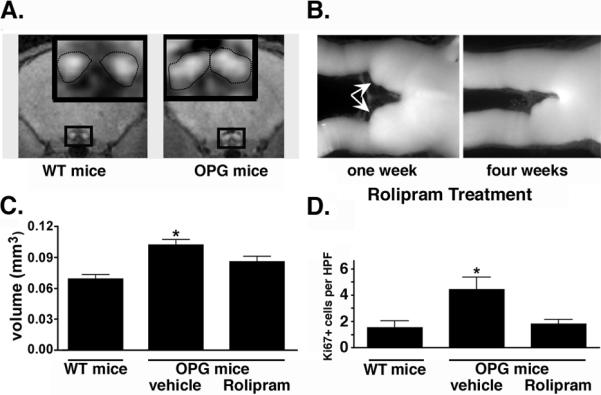
Current models of oncogenesis incorporate the contributions of chronic inflammation and aging to the patterns of tumor formation. These oncogenic pathways, involving leukocytes and fibroblasts, are not readily applicable to brain tumors (glioma), and other mechanisms must account for microenvironmental influences on central nervous system tumorigenesis. Previous studies from our laboratories have used neurofibromatosis-1 (NF1) genetically engineered mouse (GEM) models to understand the spatial restriction of glioma formation to the optic pathway of young children. Based on our initial findings, we hypothesize that brain region-specific differences in cAMP levels account for the pattern of NF1 gliomagenesis. To provide evidence that low levels of cAMP promote glioma formation in NF1, we generated foci of decreased cAMP in brain regions where gliomas rarely form in children with NF1. Focal cAMP reduction was achieved by forced expression of phosphodiesterase 4A1 (PDE4A1) in the cortex of Nf1 GEM strains. Ectopic PDE4A1 expression produced hypercellular lesions with features of human NF1-associated glioma. Conversely, pharmacologic elevation of cAMP with the PDE4 inhibitor rolipram dramatically inhibited optic glioma growth and tumor size in Nf1 GEM in vivo. Together, these results indicate that low levels of cAMP in a susceptible Nf1 mouse strain are sufficient to promote gliomagenesis, and justify the implementation of cAMP-based stroma-targeted therapies for glioma.
(c)2010 AACR.
Figures
Similar articles
-
Spatiotemporal differences in CXCL12 expression and cyclic AMP underlie the unique pattern of optic glioma growth in neurofibromatosis type 1.Cancer Res. 2007 Sep 15;67(18):8588-95. doi: 10.1158/0008-5472.CAN-06-2220. Cancer Res. 2007. PMID: 17875698
-
CXCL12 alone is insufficient for gliomagenesis in Nf1 mutant mice.J Neuroimmunol. 2010 Jul 27;224(1-2):108-13. doi: 10.1016/j.jneuroim.2010.05.002. J Neuroimmunol. 2010. PMID: 20554030 Free PMC article.
-
The cyclic AMP pathway is a sex-specific modifier of glioma risk in type I neurofibromatosis patients.Cancer Res. 2015 Jan 1;75(1):16-21. doi: 10.1158/0008-5472.CAN-14-1891. Epub 2014 Nov 7. Cancer Res. 2015. PMID: 25381154 Free PMC article.
-
Insights into optic pathway glioma vision loss from mouse models of neurofibromatosis type 1.J Neurosci Res. 2019 Jan;97(1):45-56. doi: 10.1002/jnr.24250. Epub 2018 Apr 28. J Neurosci Res. 2019. PMID: 29704429 Free PMC article. Review.
-
Optic Pathway Gliomas in Neurofibromatosis Type 1.J Child Neurol. 2018 Jan;33(1):73-81. doi: 10.1177/0883073817739509. J Child Neurol. 2018. PMID: 29246098 Free PMC article. Review.
Cited by
-
Somatic neurofibromatosis type 1 (NF1) inactivation characterizes NF1-associated pilocytic astrocytoma.Genome Res. 2013 Mar;23(3):431-9. doi: 10.1101/gr.142604.112. Epub 2012 Dec 5. Genome Res. 2013. PMID: 23222849 Free PMC article.
-
Emerging insights into the molecular and cellular basis of glioblastoma.Genes Dev. 2012 Apr 15;26(8):756-84. doi: 10.1101/gad.187922.112. Genes Dev. 2012. PMID: 22508724 Free PMC article. Review.
-
Treatment with Cyclic AMP Activators Reduces Glioblastoma Growth and Invasion as Assessed by Two-Photon Microscopy.Cells. 2021 Mar 4;10(3):556. doi: 10.3390/cells10030556. Cells. 2021. PMID: 33806549 Free PMC article.
-
A RASopathy gene commonly mutated in cancer: the neurofibromatosis type 1 tumour suppressor.Nat Rev Cancer. 2015 May;15(5):290-301. doi: 10.1038/nrc3911. Epub 2015 Apr 16. Nat Rev Cancer. 2015. PMID: 25877329 Free PMC article. Review.
-
Sex differences in GBM revealed by analysis of patient imaging, transcriptome, and survival data.Sci Transl Med. 2019 Jan 2;11(473):eaao5253. doi: 10.1126/scitranslmed.aao5253. Sci Transl Med. 2019. PMID: 30602536 Free PMC article.
References
-
- Laconi E, Doratiotto S, Vineis P. The microenvironments of multistage carcinogenesis. Semin Cancer Biol. 2008;18:322–9. - PubMed
-
- Tlsty TD, Coussens LM. Tumor stroma and regulation of cancer development. Annu Rev Pathol. 2006;1:119–50. - PubMed
-
- Listernick R, Charrow J, Greenwald M, Mets M. Natural history of optic pathway tumors in children with neurofibromatosis type 1: a longitudinal study. J Pediatr. 1994;125:63–6. - PubMed
-
- Guillamo JS, Creange A, Kalifa C, et al. Prognostic factors of CNS tumours in Neurofibromatosis 1 (NF1): a retrospective study of 104 patients. Brain. 2003;126:152–60. - PubMed
Publication types
MeSH terms
Substances
Grants and funding
LinkOut - more resources
Full Text Sources
Molecular Biology Databases
Research Materials
Miscellaneous
