

The phosphoinositide 3-kinase inhibitor PI-103 downregulates choline kinase alpha leading to phosphocholine and total choline decrease detected by magnetic resonance spectroscopy
- PMID: 20551061
- PMCID: PMC2896552
- DOI: 10.1158/0008-5472.CAN-09-4476
The phosphoinositide 3-kinase inhibitor PI-103 downregulates choline kinase alpha leading to phosphocholine and total choline decrease detected by magnetic resonance spectroscopy
Abstract
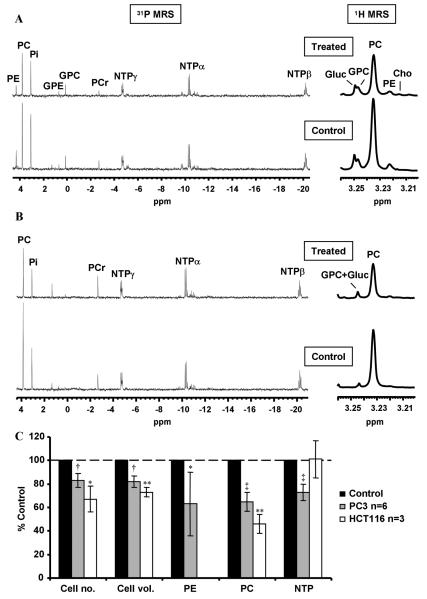
The phosphoinositide 3-kinase (PI3K) pathway is a major target for cancer drug development. PI-103 is an isoform-selective class I PI3K and mammalian target of rapamycin inhibitor. The aims of this work were as follows: first, to use magnetic resonance spectroscopy (MRS) to identify and develop a robust pharmacodynamic (PD) biomarker for target inhibition and potentially tumor response following PI3K inhibition; second, to evaluate mechanisms underlying the MRS-detected changes. Treatment of human PTEN null PC3 prostate and PIK3CA mutant HCT116 colon carcinoma cells with PI-103 resulted in a concentration- and time-dependent decrease in phosphocholine (PC) and total choline (tCho) levels (P < 0.05) detected by phosphorus ((31)P)- and proton ((1)H)-MRS. In contrast, the cytotoxic microtubule inhibitor docetaxel increased glycerophosphocholine and tCho levels in PC3 cells. PI-103-induced MRS changes were associated with alterations in the protein expression levels of regulatory enzymes involved in lipid metabolism, including choline kinase alpha (ChoK(alpha)), fatty acid synthase (FAS), and phosphorylated ATP-citrate lyase (pACL). However, a strong correlation (r(2) = 0.9, P = 0.009) was found only between PC concentrations and ChoK(alpha) expression but not with FAS or pACL. This study identified inhibition of ChoK(alpha) as a major cause of the observed change in PC levels following PI-103 treatment. We also showed the capacity of (1)H-MRS, a clinically well-established technique with higher sensitivity and wider applicability compared with (31)P-MRS, to assess response to PI-103. Our results show that monitoring the effects of PI3K inhibitors by MRS may provide a noninvasive PD biomarker for PI3K inhibition and potentially of tumor response during early-stage clinical trials with PI3K inhibitors.
Copyright 2010 AACR.
Figures


Similar articles
-
Lactate and choline metabolites detected in vitro by nuclear magnetic resonance spectroscopy are potential metabolic biomarkers for PI3K inhibition in pediatric glioblastoma.PLoS One. 2014 Aug 1;9(8):e103835. doi: 10.1371/journal.pone.0103835. eCollection 2014. PLoS One. 2014. PMID: 25084455 Free PMC article.
-
De novo phosphatidylcholine synthesis is required for autophagosome membrane formation and maintenance during autophagy.Autophagy. 2020 Jun;16(6):1044-1060. doi: 10.1080/15548627.2019.1659608. Epub 2019 Sep 13. Autophagy. 2020. PMID: 31517566 Free PMC article.
-
Metabolic consequences of treatment with AKT inhibitor perifosine in breast cancer cells.NMR Biomed. 2012 Feb;25(2):379-88. doi: 10.1002/nbm.1764. Epub 2011 Aug 23. NMR Biomed. 2012. PMID: 22253088 Free PMC article.
-
Choline kinase: an important target for cancer.Curr Med Chem. 2006;13(10):1169-86. doi: 10.2174/092986706776360923. Curr Med Chem. 2006. PMID: 16719778 Review.
-
Drugging the PI3 kinome: from chemical tools to drugs in the clinic.Cancer Res. 2010 Mar 15;70(6):2146-57. doi: 10.1158/0008-5472.CAN-09-4355. Epub 2010 Feb 23. Cancer Res. 2010. PMID: 20179189 Free PMC article. Review.
Cited by
-
CDP-choline accumulation in breast and colorectal cancer cells treated with a GSK-3-targeting inhibitor.MAGMA. 2019 Apr;32(2):227-235. doi: 10.1007/s10334-018-0719-3. Epub 2018 Nov 16. MAGMA. 2019. PMID: 30446846 Free PMC article.
-
Imaging markers of response to combined BRAF and MEK inhibition in BRAF mutated vemurafenib-sensitive and resistant melanomas.Oncotarget. 2018 Mar 30;9(24):16832-16846. doi: 10.18632/oncotarget.24709. eCollection 2018 Mar 30. Oncotarget. 2018. PMID: 29682188 Free PMC article.
-
Response Detection of Castrate-Resistant Prostate Cancer to Clinically Utilised and Novel Treatments by Monitoring Phospholipid Metabolism.Biomed Res Int. 2017;2017:4793465. doi: 10.1155/2017/4793465. Epub 2017 Jun 22. Biomed Res Int. 2017. PMID: 28717648 Free PMC article.
-
Current opportunities and challenges of magnetic resonance spectroscopy, positron emission tomography, and mass spectrometry imaging for mapping cancer metabolism in vivo.Biomed Res Int. 2014;2014:625095. doi: 10.1155/2014/625095. Epub 2014 Mar 3. Biomed Res Int. 2014. PMID: 24724090 Free PMC article. Review.
-
In vitro nuclear magnetic resonance spectroscopy metabolic biomarkers for the combination of temozolomide with PI3K inhibition in paediatric glioblastoma cells.PLoS One. 2017 Jul 13;12(7):e0180263. doi: 10.1371/journal.pone.0180263. eCollection 2017. PLoS One. 2017. PMID: 28704425 Free PMC article.
References
-
- Gadian DG. The information available from NMR. NMR and its applications to living systems. 2 ed. Oxford University Press Inc; New York: 1995. pp. 29–64.
-
- Payne GS, Leach MO. Applications of magnetic resonance spectroscopy in radiotherapy treatment planning. (Spec No 1).Br J Radiol. 2006;79:S16–S26. - PubMed
-
- Shah N, Sattar A, Benanti M, Hollander S, Cheuck L. Magnetic resonance spectroscopy as an imaging tool for cancer: a review of the literature. J Am Osteopath Assoc. 2006;106:23–7. - PubMed
-
- Negendank W. Studies of human tumours by MRS: a review. NMR Biomed. 1992;5:303–24. - PubMed
-
- Smith TAD, Bush C, Jameson C, et al. Phospholipid metabolites, prognosis and proliferation in human breast carcinoma. NMR Biomed. 1993;6:318–23. - PubMed
Publication types
MeSH terms
Substances
Grants and funding
LinkOut - more resources
Full Text Sources
Other Literature Sources
Molecular Biology Databases
Research Materials
Miscellaneous
