. 2010 Aug 20;285(34):26390-405.
doi: 10.1074/jbc.M110.142299. Epub 2010 Jun 15.

GABA(A) receptor alpha1 subunit mutation A322D associated with autosomal dominant juvenile myoclonic epilepsy reduces the expression and alters the composition of wild type GABA(A) receptors

Affiliations

GABA(A) receptor alpha1 subunit mutation A322D associated with autosomal dominant juvenile myoclonic epilepsy reduces the expression and alters the composition of wild type GABA(A) receptors

Li Ding et al. J Biol Chem. .

Abstract

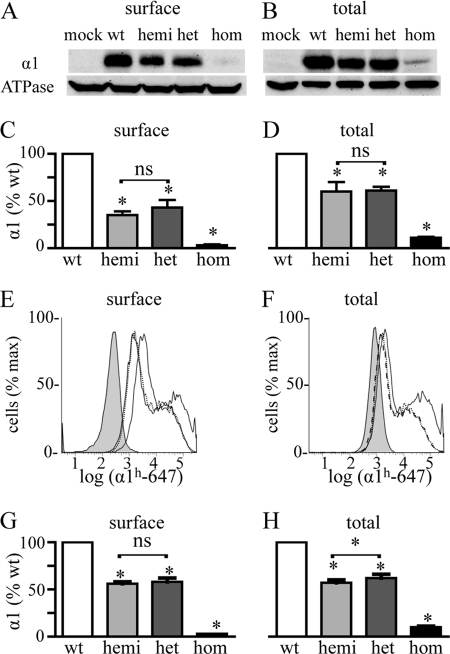
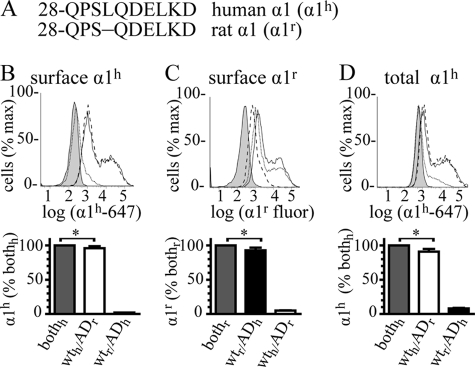
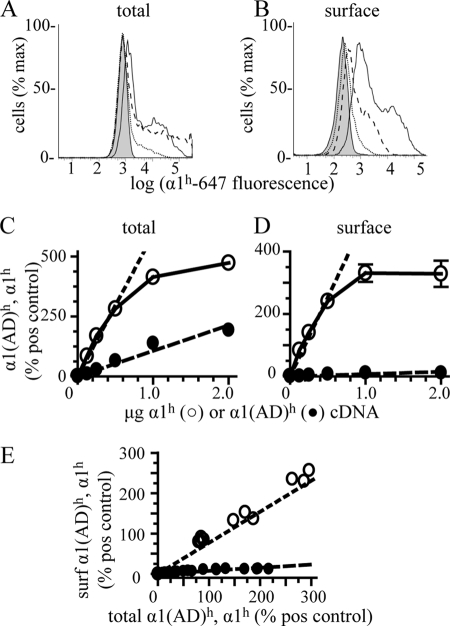
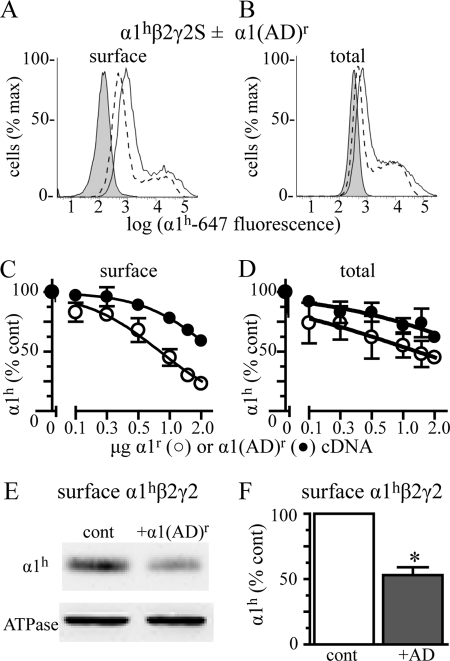
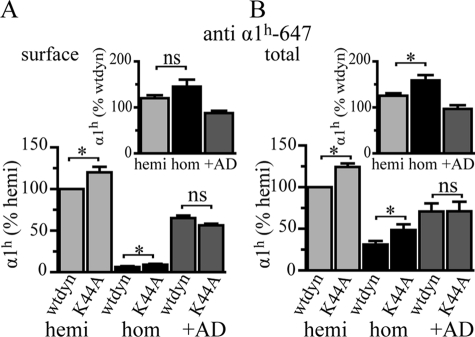
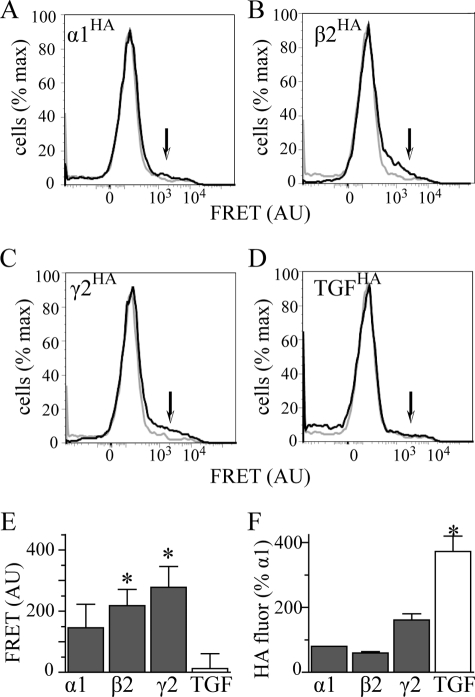
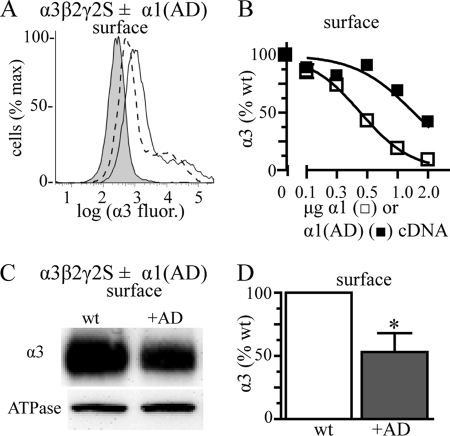
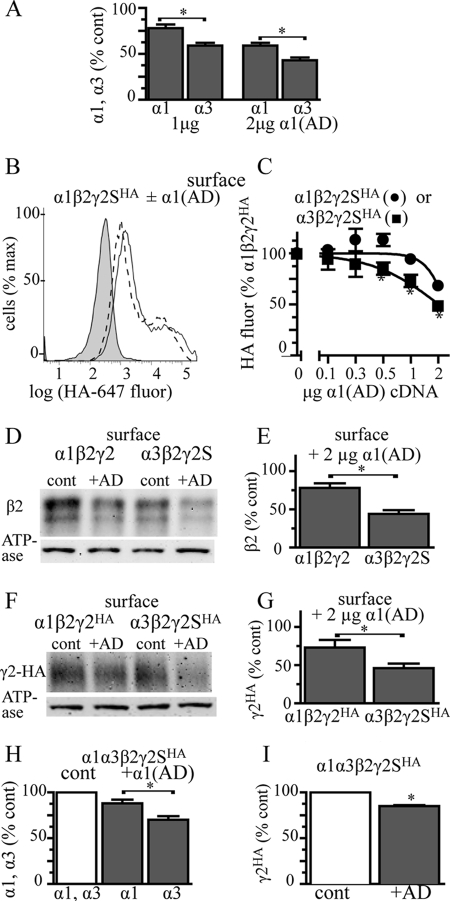
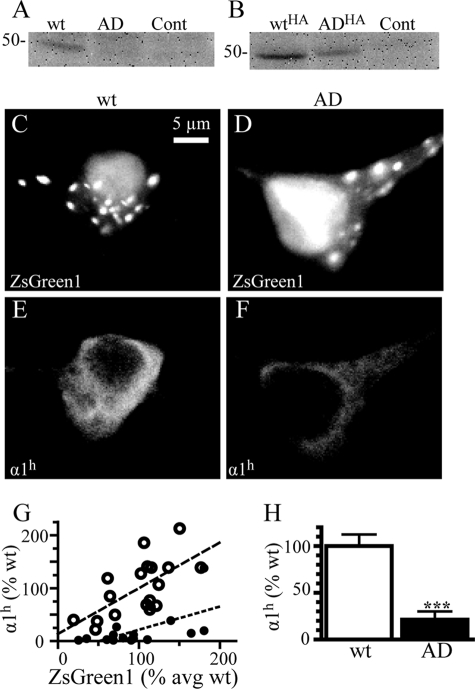
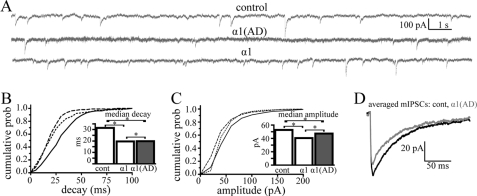
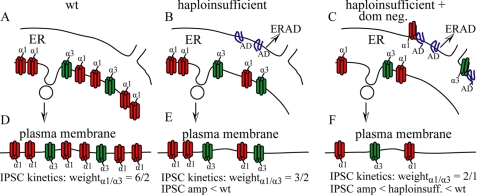
A GABA(A) receptor (GABA(A)R) alpha1 subunit mutation, A322D (AD), causes an autosomal dominant form of juvenile myoclonic epilepsy (ADJME). Previous studies demonstrated that the mutation caused alpha1(AD) subunit misfolding and rapid degradation, reducing its total and surface expression substantially. Here, we determined the effects of the residual alpha1(AD) subunit expression on wild type GABA(A)R expression to determine whether the AD mutation conferred a dominant negative effect. We found that although the alpha1(AD) subunit did not substitute for wild type alpha1 subunits on the cell surface, it reduced the surface expression of alpha1beta2gamma2 and alpha3beta2gamma2 receptors by associating with the wild type subunits within the endoplasmic reticulum and preventing them from trafficking to the cell surface. The alpha1(AD) subunit reduced surface expression of alpha3beta2gamma2 receptors by a greater amount than alpha1beta2gamma2 receptors, thus altering cell surface GABA(A)R composition. When transfected into cultured cortical neurons, the alpha1(AD) subunit altered the time course of miniature inhibitory postsynaptic current kinetics and reduced miniature inhibitory postsynaptic current amplitudes. These findings demonstrated that, in addition to causing a heterozygous loss of function of alpha1(AD) subunits, this epilepsy mutation also elicited a modest dominant negative effect that likely shapes the epilepsy phenotype.


Figures

FIGURE 1.
FIGURE 1.
Effect of heterozygous α1(AD) subunit expression on surface and total α1 subunit expression. We transfected HEK293T cells with empty plasmid (negative control) or 0.250 μg of β2 and γ2 subunit cDNA and either 0.250 μg of wild type α1 (wt), 0.125 μg α1 (hemizygous (hemi)), 0.125 μg each of α1 and α1(AD) (heterozygous (het)), or 0.250 μg of α1(AD) (homozygous (hom)) cDNA. We biotinylated surface proteins and performed Western blots to determine the surface (A and C) and total (B and D) GABAAR α1 subunit expression relative to that of the ATPase α1 subunit (loading control). Surface and total hemizygous and heterozygous α1 subunit expression was greater than that of homozygous expression and was significantly reduced relative to wild type expression (*), but there was no significant (ns) difference between them (n = 5). We also performed flow cytometry assays (E–H) as a second method to quantify the surface and total α1 subunit for cells transfected with negative control (filled histogram), wild type (solid line), hemizygous (dotted line), heterozygous (dashed line), or homozygous (data not shown) GABAAR. There was no significant difference between hemizygous and heterozygous receptors in surface α1 subunit expression (n = 7), but total heterozygous α1 subunit expression was larger than that of hemizygous α1 subunit expression (n = 6, p = 0.03).
FIGURE 2.
FIGURE 2.
Fraction of wild type α1 and mutant α1(AD) subunits in heterozygous expression. We depicted the N-terminal amino acids of the mature human (α1h) and rat (α1r) α1 subunits (A) with the amino acids numbered starting at the N termini of the signal peptides. The Gln-28 residues are located at the putative N termini of the mature peptides. The full-length mature α1h and α1r sequences are identical except that the rat sequence lacks leucine 31 (leucine 4 as numbered from the putative N terminus of the mature peptide). We transfected HEK293T cells with mock vector (negative control, filled histograms) or β2 and γ2 subunits (0.250 μg) and heterozygous α1 subunits in which the sequences of the wild type and mutant subunits were both human or both rat (bothh, bothr, solid lines and gray bars). We also transfected cells with heterozygous receptors in which the sequence of the wild type subunit was human and the mutant subunit was rat (wth/ADr, dashed lines, white bars), and the sequence of the wild type subunit was rat and the mutant subunit was human (wtr/ADh, dotted lines, black bars). We stained surface receptors with either the anti-α1h (B) or α1r antibody (C) and total receptors with the anti-α1h antibody (D). We determined the fraction of surface heterozygous subunits composed of wild type subunit by dividing α1h mean fluorescence in WTh/ADr, by the α1h mean fluorescence in bothh cells (B, 96 ± 3%). We obtained a similar result when we divided α1r staining in WTr/ADh cells by that in bothr cells (C, 92 ± 2%). Similarly, we determined the fraction of mutant subunit in surface heterozygous receptors by dividing α1(AD)h staining in WTr/ADh cells by that in bothh cells (B, 2 ± 0.1%) and dividing α1(AD)r staining in WTh/ADr cells by bothr cells (C, 5 ± 0.4%). In total, heterozygous subunits, the wild type α1h subunit included 91 ± 4% heterozygous expression and the mutant α1h subunit included 8 ± 4% heterozygous expression. In both surface and total heterozygous expression, the contribution of the wild type subunit was modestly but significantly (*, p < 0.05) less than 100%.
FIGURE 3.
FIGURE 3.
Effect of increasing mutant α1(AD) subunit cDNA on surface and total α1(AD) subunit protein expression. We transfected HEK293T cells with empty vector (negative control, shaded histograms) or 0.250 μg of β2 and γ2S subunits and 0.125 μg of α1h subunit cDNA (hemizygous positive control, solid line histogram) or 0.250 μg of β2 and γ2S subunits, 0.125 μg of α1r subunit, and increasing amounts of either α1(AD)h or α1h subunit cDNA. We measured the total (A and C) and surface (B and D) α1(AD)h and α1h subunit fluorescence by flow cytometry. A and B, dotted lines depict the fluorescence of cells transfected with 0.125 μg of α1(AD)h subunits, and the dashed lines depict the fluorescence of cells transfected with 2 μg of α1(AD)h subunits. C and D, we depicted the α1(AD)h (●) and α1h (○) fluorescence normalized to positive control for each mass of α1(AD)h or α1h subunit cDNA that we transfected. When measuring total α1(AD)h and α1h expression (C), increasing both α1(AD)h and α1h subunit cDNA caused linear increases in α1(AD)h and α1h subunit protein expression until α1h subunit expression saturated when it was greater than 300% that of positive (pos) control. When measuring surface α1(AD)h and α1h expression (D), increasing α1h subunit cDNA caused proportional increases in α1h subunit expression, but increasing α1(AD)h subunit cDNA resulted in very little change in surface α1(AD)h subunit expression. E, we replotted the surface (surf) α1(AD)h and α1h subunit expression as a function of total expression. Both surface α1(AD)h and α1h subunit expression increased linearly with total expression (r2 = 0.82 and 0.95, respectively, n ≥ 3). However, there was an 8-fold greater increased surface α1h subunit expression than α1(AD)h subunit expression for equal increases in total expression. To determine whether the presence of the wild type α1r subunit facilitated the surface trafficking of α1(AD)h subunits, we repeated experiments in the absence of the α1r subunit and found no significant difference in the surface expression of the α1(AD)h subunit in the absence of the α1r subunit (n = 3, data not shown).
FIGURE 4.
FIGURE 4.
Effect of α1(AD) subunit expression on surface and total α1β2γ2 expression. We transfected HEK293T cells with empty vector (negative control, shaded histograms) or 0.250 μg of β2 and γ2S subunits and 0.125 μg α1h subunit cDNA (hemizygous) and with varying masses (0–2 μg) of α1r or α1(AD)r cDNA. We quantified the surface (A and C) and total (B and D) α1h subunit expression using flow cytometry with anti-α1h subunit antibodies. A and B, we depicted hemizygous fluorescence as a solid line and hemizygous + 2 μg of α1(AD)r fluorescence as a dashed line. C and D, we plotted α1(AD)h (●) and α1h (○) subunit fluorescence normalized to that of hemizygous subunit fluorescence versus the masses of α1(AD)h or α1h cDNA that was transfected. Increasing the masses of α1(AD)r subunit cDNA reduced surface and total α1h subunit expression. We also determined the effect 2 μg of α1(AD)r subunit cDNA co-transfection on surface α1hβ2γ2 receptor expression using biotinylation assays with Western blot (E and F). We stained the Western blots with the anti-α1h subunit antibody and quantified surface α1h subunit relative to that of the Na+/K+-ATPase α subunit (loading control (cont)). The addition of 2 μg of α1(AD)r subunit cDNA (+AD) reduced surface expression of α1hβ2γ2 receptors by 46 ± 6% (n = 4; p = 0.005). The α1(AD)r subunit did not alter the surface expression of the endogenous ATPase α subunit (97 ± 10%, n = 5).
FIGURE 5.
FIGURE 5.
Inhibiting dynamin-mediated endocytosis on the dominant effect of the α1(AD) subunit. We transfected HEK293T cells with 0.250 μg of β2 and γ2S subunit cDNA and either 0.125 μg of human wild type α1h subunit (hemi, light gray), 0.250 μg of human α1(AD)h subunit (hom, black), or 0.125 μg of human wild type α1h subunit and 2 μg α1(AD)r subunit (+AD, dark gray). In addition, we also co-transfected the cells with either 0.375 μg of wild type (wtdyn) or dominant negative (K44A) dynamin. We measured surface and total human α1 subunit expression by flow cytometry and normalized each value to the expression of the hemizygous samples that were co-transfected with wild type dynamin. In the insets, we plotted the percentage change in α1h and α1(AD)h expression because of the K44A dynamin. The K44A dynamin increased the total and surface α1 subunit expression in the hemizygous and homozygous conditions (p < 0.05), but not alter the dominant effect in the +α1(AD)r condition (n = 5). The K44A dynamin significantly increased total homozygous α1(AD)h expression to a greater extent than hemizygous α1h expression (p < 0.01). ns = p ≥ 0.05; *, p < 0.05.
FIGURE 6.
FIGURE 6.
Interactions of the α1(AD) subunit with wild type GABAAR subunits. We transfected HEK293T cells with 2 μg of α1(AD)h subunit and 0.125:0.250:0.250 μg ratios of either α1HAβ2γ2 (A), α1rβ2HAγ2 (B), or α1rβ2γ2HA subunits to form receptors in which either the α1, β2, or γ2 subunit is tagged with the HA epitope. In addition, to determine whether the α1(AD)h subunit interacted nonspecifically with the TGFHA protein, we transfected cells with 2 μg of α1(AD)h subunit, a 0.125:0.250:0.250 μg ratio of α1rβ2γ2 subunits, and 0.250 μg of TGFHA (D). We permeabilized the cells and stained them with either the anti-α1h-647 antibody (FRET acceptor), the antiHA-555 antibody (FRET donor), or both anti-α1h-647 and antiHA-555 antibodies. A–D are flow cytometry histograms of FRET fluorescence. The gray line plots the histogram for cells stained with only the α1h-647 acceptor antibody, and the black line plots the histogram for cells stained with both HA-555 donor and α1h-647 acceptor antibodies. The arrows point to the regions of the histograms where one would find specific FRET fluorescence. We quantified the specific FRET fluorescence and plotted it in E (n ≥ 5). Samples transfected with α1β2HAγ2 and α1β2γ2HA receptors possessed substantial FRET fluorescence that significantly differed compared with samples transfected with TGFHA protein. This difference in FRET fluorescence did not result from reduced HA fluorescence from the TGFHA protein because TGFHA possessed substantially more HA florescence than HA-tagged GABAAR subunits (F). AU, arbitrary units.
FIGURE 7.
FIGURE 7.
Effect of the α1(AD) subunit on wild type α3β2γ2 GABAAR. We transfected HEK293T cells with empty vector (negative control, shaded histogram) or 0.250 μg of α3, β2, and γ2S subunits without any additional subunit (wild type) or with varying masses (0.125–2 μg) of mutant α1(AD) or wild type (wt) α1 subunit cDNA. We quantified the surface (A and B) α3 subunit expression using flow cytometry. A, we presented a sample flow cytometry histogram with wild type fluorescence as a solid line and wild type + 2 μg of α1(AD) fluorescence as a dashed line. B, we quantified the surface α3 subunit fluorescence in the presence of the different amounts of α1(AD) (■, n ≥ 4) or wild type α1 (□, n = 3) subunit cDNA and normalized the α3 subunit fluorescence to that of wild type cells. Increasing the mass of α1(AD) and α1 subunit cDNA reduced surface α3 subunit expression. We also determined the effect of 2 μg of α1(AD) subunit cDNA co-transfection on surface α3β2γ2 receptor expression using biotinylation assays with Western blot (C and D). We stained the Western blots with the anti-α3 subunit antibody and quantified surface α3 subunit relative to that of the Na+/K+-ATPase α subunit (loading control). The presence of the α1(AD) subunit reduced surface expression of α3β2γ2 receptors by 47 ± 15% (n = 6; p = 0.024). *, p < 0.05.
FIGURE 8.
FIGURE 8.
Effect of the α1(AD) subunit on surface β2 and γ2 subunit expression in α1β2γ2 and α3β2γ2 receptors. A, we replotted the data from Figs. 4 and 7 depicting the effect of 1.0 and 2.0 μg of α1(AD)r subunit cDNA on surface α1 and α3 subunit expression. The α1(AD)r subunit reduced surface α3 subunit expression to a greater extent than α1 subunit expression (p < 0.002). B and C, we transfected HEK293T cells with empty vector (negative control (cont)) or 0.250 μg of β2 and γ2SHA cDNA and either 0.125 μg of α1 subunit (hemizygous α1) or 0.250 α3 subunit (WT α3). We co-transfected different masses (0–2 μg) of mutant α1(AD) subunit cDNA. We quantified the surface γ2SHA subunit expression using an anti-HA antibody and flow cytometry. B presents a sample flow cytometry histogram that plots the γ2HA fluorescence versus the number of cells. Negative control fluorescence is shaded; fluorescence from α1β2γ2HA receptors in the absence of the α1(AD) subunit is a solid line, and fluorescence from α1β2γ2HA receptors + 2 μg of α1(AD) cDNA is a dashed line. C, we quantified the surface γ2HA expression for α1β2γ2HA (●) and α3β2γ2HA (■) receptors for each amount of α1(AD) subunit cDNA. The γ2HA subunit fluorescence was normalized to the γ2HA fluorescence in the α1β2γ2 receptors in the absence of α1(AD) subunit. In the absence of the α1(AD) subunit, there was no significant difference in γ2HA expression between the α1β2γ2HA and α3β2γ2HA receptors (99 ± 5%, p = 0.895). Addition of the α1(AD) subunit caused concentration-dependent reductions in γ2HA subunit that were greater in α3β2γ2HA than α1β2γ2HA receptors (* p < 0.05, n ≥ 6). Biotinylation and Western blot assays (d–G) demonstrated that transfecting 2 μg of α1(AD) subunit cDNA reduced surface β2 subunit expression to a greater extent in α3β2γ2 receptors (56 ± 5%) than α1β2γ2 receptors (22 ± 6%, n = 5, p = 0.002) and also reduced γ2HA subunit expression by a greater extent in α3β2γ2HA receptors (54 ± 6%) than α1β2γ2HA receptors (27 ± 10%, n = 5, p = 0.049). Finally, we transfected HEK293T cells with α1h, α3, β2, and γ2HA subunits in a 0.125:0.250:0.250:0.250 ratio and with or without 1.0 μg of α1(AD)r subunit. We determined the amount of surface α1h, α3, and γ2HA subunit expression by flow cytometry. The α1(AD)r subunit reduced α3 subunit expression (30 ± 4%) to a greater extent than α1h subunit expression (12 ± 4%, p = 0.010, n = 5, H), and it reduced γ2HA expression by 15 ± 1% (p = 0.001, n = 5, I).
FIGURE 9.
FIGURE 9.
Effect of the AD mutation on α1(AD) subunit expression in cultured cortical neurons. We transfected DIV10 cultured cortical neurons with either control-IRES-ZsGreen1, α1h-IRES-ZsGreen1 (wt), α1(AD)h-IRES-ZsGreen1 (AD), α1HA-IRES-ZsGreen1 (WTHA), or α1(AD)HA-IRES-ZsGreen1 (ADHA). On DIV17, we performed Western blots of neuronal lysates and stained them with either the anti-α1h antibody (A, n = 4) or the anti-HA antibody (B, n = 5). Visual inspection demonstrated that the mutation substantially reduced both α1(AD)h and α1(AD)HA expression. Because of weak signal intensity, the untagged human α1(AD)h subunits in neuronal lysates could not be quantified. However, quantification of the gels stained with the anti-HA antibodies demonstrated that α1(AD)HA subunit expression was reduced by 39 ± 9% compared with wild type α1HA expression (p = 0.010). Next, in four separate experiments, we transfected DIV10 neurons with control-IRES-ZsGreen1, α1h-IRES-ZsGreen1 (wt), or α1(AD)h-IRES-ZsGreen1 (AD) and performed immunofluorescence studies on DIV17 to identify transfected neurons by ZsGreen1 fluorescence in the green channel (C and D) and recombinant α1h and anti-α1(AD)h subunit immunofluorescence in the red channel (E and F). Visual inspection demonstrated that the ZsGreen1 fluorescence localized primarily within the nuclei and in small puncta within the cytoplasm and that recombinant α1h and α1(AD)h subunits expressed diffusely throughout the soma and the dendrites. There was no significant difference in ZsGreen1 fluorescence among the control (103 ± 4%), α1h- (100 ± 9%) and α1(AD)h (99 ± 12%)-transfected cells The anti-α1h antibody specifically labeled recombinant α1h protein with the neurons transfected with control vector (n = 16) having 2 ± 1% the A546 fluorescence as those transfected with α1h (data not shown). The α1h immunofluorescence intensity correlated with the ZsGreen1 intensity for both the samples transfected with α1h (○, p = 0.003, r2 = 0.42) and α1(AD)h (●, p = 0.017, r2 = 0.35) (G). Compared with neurons transfected with α1h (n = 18), the neurons transfected with the α1(AD)h subunit possessed 21 ± 9% of the α1h immunoreactivity (H, n = 16, p < 0.001).
FIGURE 10.
FIGURE 10.
Effect of the α1(AD) subunit on mIPSCs in cultured cortical neurons. In five separate experiments, we transfected DIV10 cultured cortical neurons with either control-IRES-ZsGreen1 (control), α1-IRES-ZsGreen1 (wild type, α1), or α1(AD)-IRES-ZsGreen1 (α1(AD)). On DIV17, we identified transfected neurons by ZsGreen1 fluorescence and recorded >100 mIPSCs events from each. A, we showed sample mIPSC current traces. Transfection of both the α1 and α1(AD) subunit altered mIPSC current kinetics (B and D). B, we plotted a histogram that depicts the mIPSC decay time constants on the abscissa and the cumulative probability (prob) of an mIPSC having that decay time on the ordinate. Neurons transfected with control vector (solid line) had the biggest decay time constants followed by those transfected with α1(AD) (dotted line) and α1 (dashed line, p < 0.001). In the inset, we plotted the median mIPSC decay times. C, we plotted a histogram depicting mIPSC peak amplitudes on the abscissa and cumulative probability of a mIPSC having that peak amplitude on the ordinate. Neurons transfected with control subunit possessed larger mIPSC amplitudes than α1(AD)-transfected neurons, which possessed larger amplitudes than those transfected with α1 subunit (p < 0.001). The median mIPSC amplitudes are plotted in the inset. D, we displayed averaged (>100 events) mIPSC traces for wild type (black) and α1(AD)-transfected neurons (gray) demonstrating both the accelerated decay and reduced mIPSC amplitudes in neurons transfected with the α1(AD) subunit. *, p < 0.05.
FIGURE 11.
FIGURE 11.
Model of the effects of the α1(AD) subunit on surface GABAAR expression and isoform composition. This figure depicts our model of how the α1(AD) subunit reduces wild type surface GABAAR expression and alters their composition. GABAARs assemble in the ER (A–C) and traffic to the plasma membrane (d--F). At maturity, wild type neurons (wt, A and D) predominantly express α1β2γ2 receptors (red) but also express non-α1-containing GABAAR (depicted here as α3 GABAAR, green), and thus we depicted a 6:2 ratio of α1β2γ2 to α3β2γ2 receptors. In a purely haploinsufficient model (B and E), all the misfolded α1(AD) subunit (blue) is degraded without it interacting with wild type GABAAR. Therefore, haploinsufficient neurons express reduced α1β2γ2 receptors and unchanged non-α1-containing GABAAR. The time course of the IPSC current kinetics would result from the currents contributed from α1 and α3 subunit containing receptors weighted by their abundance on the neuron surface. Therefore, as depicted here, the α1/α3 weighting would decrease from 6/2 in wild type neurons to 3/2 in α1 haploinsufficient neurons thus producing IPSCs that more resembled α3 subunit containing GABAAR in the haploinsufficient neurons compared with wild type neurons. Our data are more consistent with a haploinsufficient plus dominant negative model (C and F). In this model, neurons degrade some α1(AD) subunit but also retain some misfolded α1(AD) subunit (blue) in the ER, which can associate with and retain a greater fraction of α3β2γ2 than α1β2γ2 receptors. This is shown here as α1(AD) retaining ⅓ α1 subunit containing receptors and ½ α3 subunit containing receptors. The retention of wild type GABAAR expression in the haploinsufficient plus dominant negative case reduces IPSC peak amplitudes to a greater extent than in the α1 haploinsufficient neurons. In addition, the selective retention of α3 subunit containing receptors increases the α1/α3 weighting from 3/2 to 2/1 thus producing IPSC current kinetics that are more similar to α1 subunit containing GABAAR than in the α1 haploinsufficient condition.

Similar articles

Cited by

References

    1. Brooks-Kayal A. R., Jin H., Price M., Dichter M. A. (1998) J. Neurochem. 70, 1017–1028 - PubMed
    1. Laurie D. J., Wisden W., Seeburg P. H. (1992) J. Neurosci. 12, 4151–4172 - PMC - PubMed
    1. Pirker S., Schwarzer C., Wieselthaler A., Sieghart W., Sperk G. (2000) Neuroscience 101, 815–850 - PubMed
    1. Tretter V., Ehya N., Fuchs K., Sieghart W. (1997) J. Neurosci. 17, 2728–2737 - PMC - PubMed
    1. Baumann S. W., Baur R., Sigel E. (2001) J. Biol. Chem. 276, 36275–36280 - PubMed

Publication types