Generation and analysis of partially haploid cells with Cre-mediated chromosome deletion in the lymphoid system
- PMID: 20551312
- PMCID: PMC2923996
- DOI: 10.1074/jbc.M110.139196
Generation and analysis of partially haploid cells with Cre-mediated chromosome deletion in the lymphoid system
Abstract
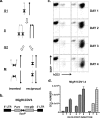
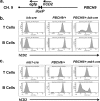
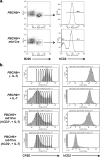
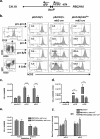
The fast accumulation of mutant mouse strains in recent years has provided an invaluable resource for phenotype-based genetic screens. However, study of lymphoid phenotypes can be obscured or impractical if homozygous mutations cause early embryonic defects. To aid phenotype screening of germ line mutations in the lymphoid system, we developed a method to induce loss of heterozygosity (LOH) in developing lymphocytes through chromosome deletion. Chromosome deletion was triggered by Cre/loxP-mediated inverse sister chromatid recombination in the G(2)/M phase of the cell cycle, leading to the generation of daughter cells missing part of or the entire recombinant chromosome. We show that the resulting cells were viable and capable of additional rounds of cell division, thus providing raw materials for subsequent phenotypic assessment. We used the recombination system to induce LOH at the E2A locus in developing B cells. A significant loss of pro-B and pre-B cells was observed when the wild-type allele was removed by chromosome deletion from the E2A heterozygous mice, a result consistent with the required role for E2A in B cell development. We also demonstrated the effectiveness of Cre-mediated chromosome deletion in the LOH assay for HEB function in T cell development. Thus, the Cre-mediated chromosome deletion provides a new and effective method for genome-wide assessment of germ line mutations in the lymphoid system.
Figures


Similar articles
-
Target chromosomes of inducible deletion by a Cre/inverted loxP system in mouse embryonic stem cells.Chromosome Res. 2009;17(4):443-50. doi: 10.1007/s10577-009-9035-0. Epub 2009 Mar 31. Chromosome Res. 2009. PMID: 19333768
-
Rapid induction of large chromosomal deletions by a Cre/inverted loxP system in mouse ES Cell hybrids.J Mol Biol. 2008 Apr 25;378(2):328-36. doi: 10.1016/j.jmb.2008.01.065. Epub 2008 Feb 2. J Mol Biol. 2008. PMID: 18353367
-
Systematic hybrid LOH: a new method to reduce false positives and negatives during screening of yeast gene deletion libraries.Yeast. 2006 Oct-Nov;23(14-15):1097-106. doi: 10.1002/yea.1423. Yeast. 2006. PMID: 17083134
-
From mouse to man: generating megabase chromosome rearrangements.Trends Genet. 2001 Jun;17(6):331-9. doi: 10.1016/s0168-9525(01)02321-6. Trends Genet. 2001. PMID: 11377795 Review.
-
Generation of loss of heterozygosity and its dependency on p53 status in human lymphoblastoid cells.Environ Mol Mutagen. 2005 Mar-Apr;45(2-3):162-76. doi: 10.1002/em.20113. Environ Mol Mutagen. 2005. PMID: 15688360 Review.
Cited by
-
Tracking proliferative history in lymphocyte development with cre-mediated sister chromatid recombination.PLoS Genet. 2013 Oct;9(10):e1003887. doi: 10.1371/journal.pgen.1003887. Epub 2013 Oct 31. PLoS Genet. 2013. PMID: 24204301 Free PMC article.
-
Modeling specific aneuploidies: from karyotype manipulations to biological insights.Chromosome Res. 2023 Aug 29;31(3):25. doi: 10.1007/s10577-023-09735-7. Chromosome Res. 2023. PMID: 37640903 Free PMC article. Review.
-
Whole chromosome loss and associated breakage-fusion-bridge cycles transform mouse tetraploid cells.EMBO J. 2018 Jan 17;37(2):201-218. doi: 10.15252/embj.201797630. Epub 2017 Dec 1. EMBO J. 2018. PMID: 29196303 Free PMC article.
-
Site-Specific Recombination with Inverted Target Sites: A Cautionary Tale of Dicentric and Acentric Chromosomes.Genetics. 2020 Aug;215(4):923-930. doi: 10.1534/genetics.120.303394. Epub 2020 Jun 25. Genetics. 2020. PMID: 32586890 Free PMC article.
-
A non-specific effect associated with conditional transgene expression based on Cre-loxP strategy in mice.PLoS One. 2011 May 10;6(5):e18778. doi: 10.1371/journal.pone.0018778. PLoS One. 2011. PMID: 21572998 Free PMC article.
References
-
- Collins F. S., Rossant J., Wurst W. (2007) Cell 128, 9–13 - PubMed
-
- Nord A. S., Chang P. J., Conklin B. R., Cox A. V., Harper C. A., Hicks G. G., Huang C. C., Johns S. J., Kawamoto M., Liu S., Meng E. C., Morris J. H., Rossant J., Ruiz P., Skarnes W. C., Soriano P., Stanford W. L., Stryke D., von Melchner H., Wurst W., Yamamura K., Young S. G., Babbitt P. C., Ferrin T. E. (2006) Nucleic Acids Res. 34, D642–D648 - PMC - PubMed
-
- Mitchell K. J., Pinson K. I., Kelly O. G., Brennan J., Zupicich J., Scherz P., Leighton P. A., Goodrich L. V., Lu X., Avery B. J., Tate P., Dill K., Pangilinan E., Wakenight P., Tessier-Lavigne M., Skarnes W. C. (2001) Nat. Genet. 28, 241–249 - PubMed
Publication types
MeSH terms
Substances
Grants and funding
LinkOut - more resources
Full Text Sources
Molecular Biology Databases

