Review
. 2010 Jul;77(7):686-92.
doi: 10.1002/cyto.a.20933.

Communicating subcellular distributions

Affiliations
Review

Communicating subcellular distributions

Robert F Murphy. Cytometry A. 2010 Jul.

Abstract

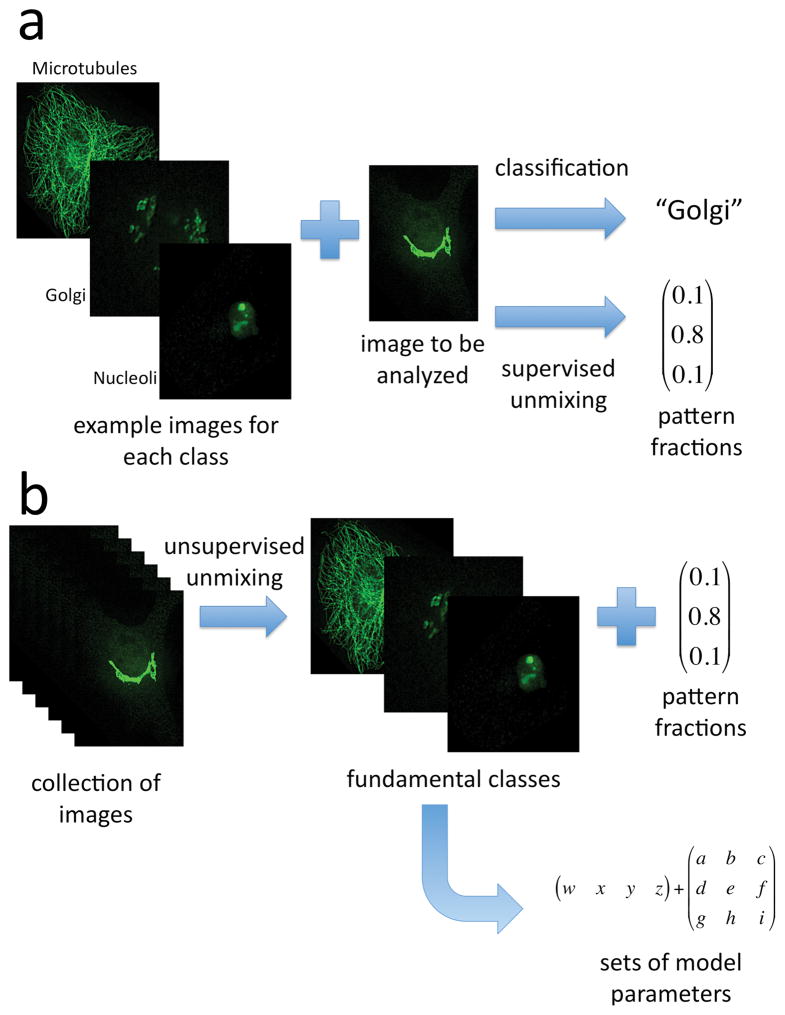
To build more accurate models of cells and tissues, the ability to incorporate information on the distributions of proteins (and other macromolecules) will become increasingly important. This review describes current progress towards determining and representing protein subcellular patterns so that the information can be used as part of systems biology efforts. Approaches to decomposing an image of the subcellular pattern of a protein give critical information about the fraction of that protein in each of a number of fundamental patterns (e.g., organelles). Methods for learning generative models from images provide a means of capturing the essential properties and variation in those properties of cell shape and organelle patterns. The combination of models of fundamental patterns and vectors specifying the fraction of a protein in each of them provide a much better means of communicating subcellular patterns than the descriptive terms that are currently used. Communicating information about subcellular patterns is important not only for systems biology simulations but also for representing results from microscopy experiments, including high content screening and imaging flow cytometry, in a transportable and generalizable manner.


Figures

Figure 1
Figure 1
Overview of approaches to communicating subcellular distributions. A) When examples are available of each of the patterns expected to be present, supervised approaches can be used. The top path shows a traditional classification approach: the example images are used to train a classifier and then the image to be analyzed is assigned to one of the classes. The lower path illustrates representing the image by a vector showing the fraction of each of the classes it contains. B) When a large collection is available, unsupervised unmixing can find the fundamental patterns that they contain as well as a vector of pattern fractions for each image. Models of each of the fundamental patterns can then be built for each of the fundamental patterns. Synthetic images can be created using the models and vectors (not shown).
Figure 2
Figure 2
Application of pattern unmixing to quantify drug effects on autophagy. Images were collected of cells expressing eGFP-LC3 in the presence or absence of various concentrations of bafilomycin A1 and used to train an unmixing model as described in the text. The fraction of drug treated pattern as a function of concentration of drug was estimated using linear unmixing (squares), multinomial unmixing (circles), and fluorescence fraction unmixing (triangles). eGFP-LC3 showed a gradual relocation between the two patterns as a function of BFA concentration. From reference (7).
Figure 3
Figure 3
Results from unsupervised pattern unmixing. The estimated fraction of each probe in a given component is plotted as a function of the expected fraction (points for both the lysosomal and mitochondrial components are shown together). The dotted line shows agreement between the two fractions. After reference (8).
Figure 4
Figure 4
Illustration of medial axis model fitting for nuclear shape. The original nuclear image (a) was processed into a binarized image (b), in which the nuclear object consists of the white pixels. The nuclear object was rotated so that its major axis is vertical (c) and converted into the medial axis representation (d). The horizontal positions of the medial axis as a function of the fractional distance along it are shown by the symbols in (e), along with a B-spline fit (solid curve). The width as a function of fractional distance is shown by the symbols in (f), along with the corresponding fit (solid curve). Scale bar, 5 μm. From reference (9).
Figure 5
Figure 5
Plot of the first two components of the low-dimensional representation of the nuclear shape computed by the diffeomorphic method discussed in the text. Each small circle corresponds to one nuclear image. Images associated with specific data points are shown on the left (diamonds) or across the bottom (squares). Each dark square corresponds, in order, to each image shown in the horizontal bottom series of images. Likewise, each light triangle corresponds to each image stacked vertically. Note that the method separates different modes of shape variation (bending and elongation) into separate coordinates. From reference (12).
Figure 6
Figure 6
Example synthetic image generated by a model learned from images of the endosomal protein transferrin. The DNA distribution is shown in red, the cell outline in blue, and transferrin-containing objects in green.

Similar articles

Cited by

References

    1. The Universal Protein Resource (UniProt) in 2010. Nucleic Acids Res. 38(Database issue):D142–8. - PMC - PubMed
    1. Ashburner M, Ball CA, Blake JA, Botstein D, Butler H, Cherry JM, Davis AP, Dolinski K, Dwight SS, Eppig JT, Harris MA, Hill DP, Issel-Tarver L, Kasarskis A, Lewis S, Matese JC, Richardson JE, Ringwald M, Rubin GM, Sherlock G. Gene ontology: tool for the unification of biology. The Gene Ontology Consortium Nat Genet. 2000;25(1):25–9. - PMC - PubMed
    1. Sprenger J, Lynn Fink J, Karunaratne S, Hanson K, Hamilton NA, Teasdale RD. LOCATE: a mammalian protein subcellular localization database. Nucleic Acids Res. 2008;36(Database issue):D230–3. - PMC - PubMed
    1. Chou KC, Shen HB. Recent progress in protein subcellular location prediction. Anal Biochem. 2007;370(1):1–16. - PubMed
    1. Shatkay H, Hoglund A, Brady S, Blum T, Donnes P, Kohlbacher O. SherLoc: high-accuracy prediction of protein subcellular localization by integrating text and protein sequence data. Bioinformatics. 2007;23(11):1410–7. - PubMed

Publication types

LinkOut - more resources