. 2010 Sep-Oct;86(5):1161-73.
doi: 10.1111/j.1751-1097.2010.00766.x.

A requirement for bid for induction of apoptosis by photodynamic therapy with a lysosome- but not a mitochondrion-targeted photosensitizer

Affiliations

A requirement for bid for induction of apoptosis by photodynamic therapy with a lysosome- but not a mitochondrion-targeted photosensitizer

Song-Mao Chiu et al. Photochem Photobiol. 2010 Sep-Oct.

Abstract

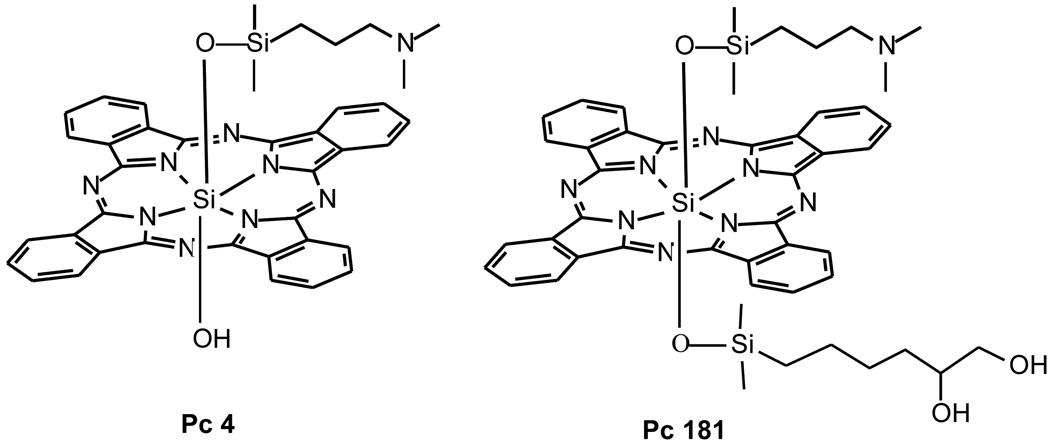
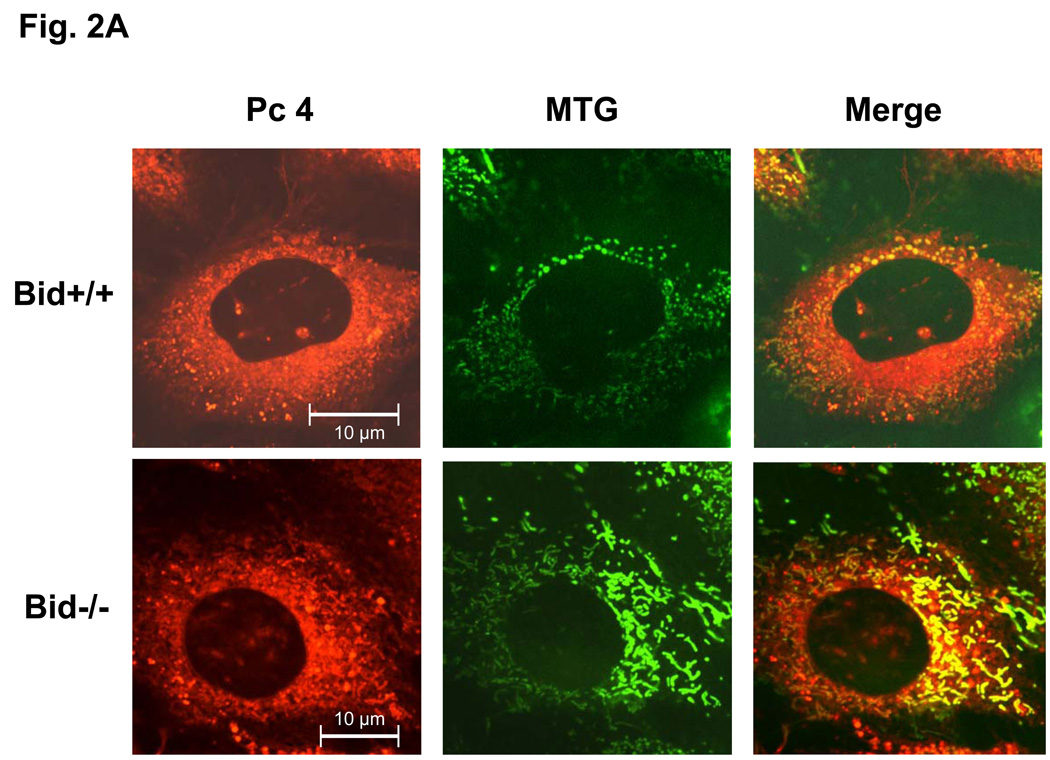
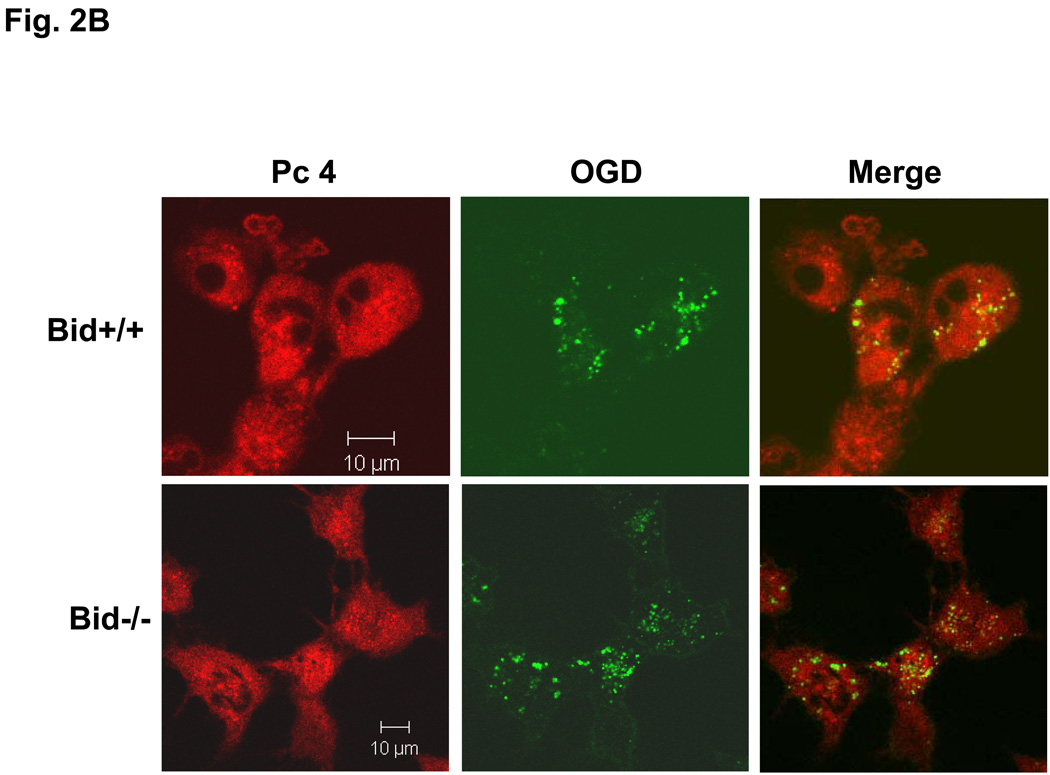
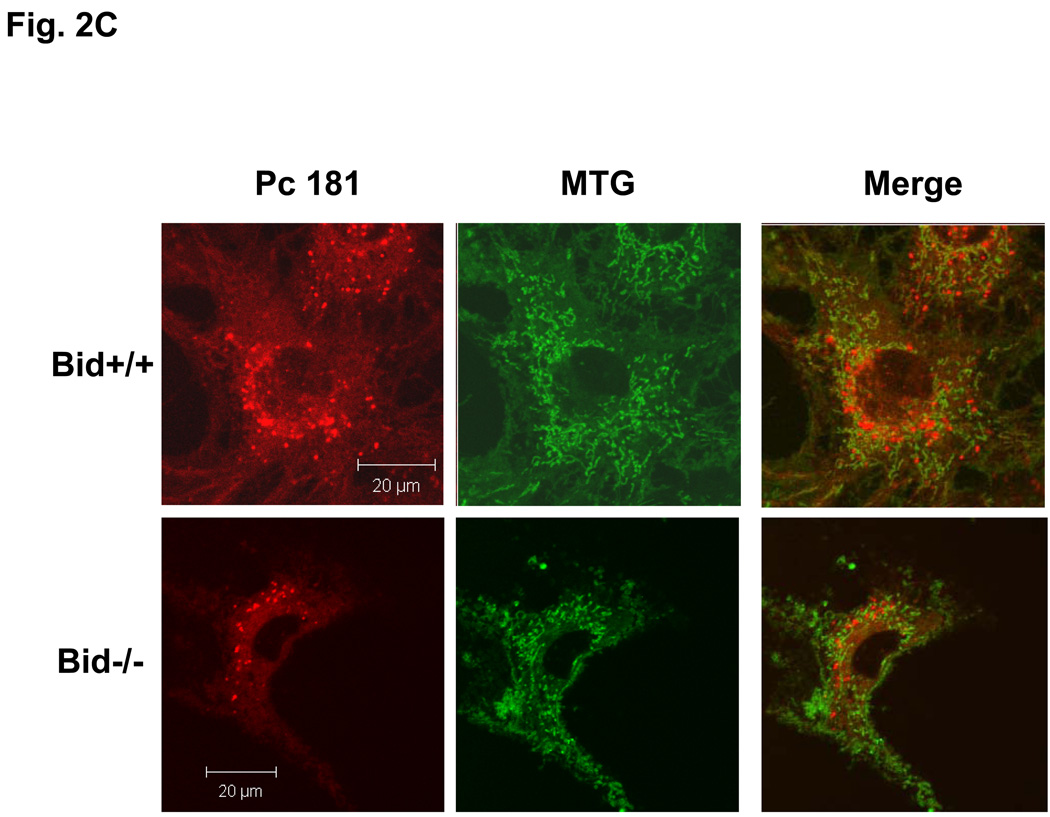
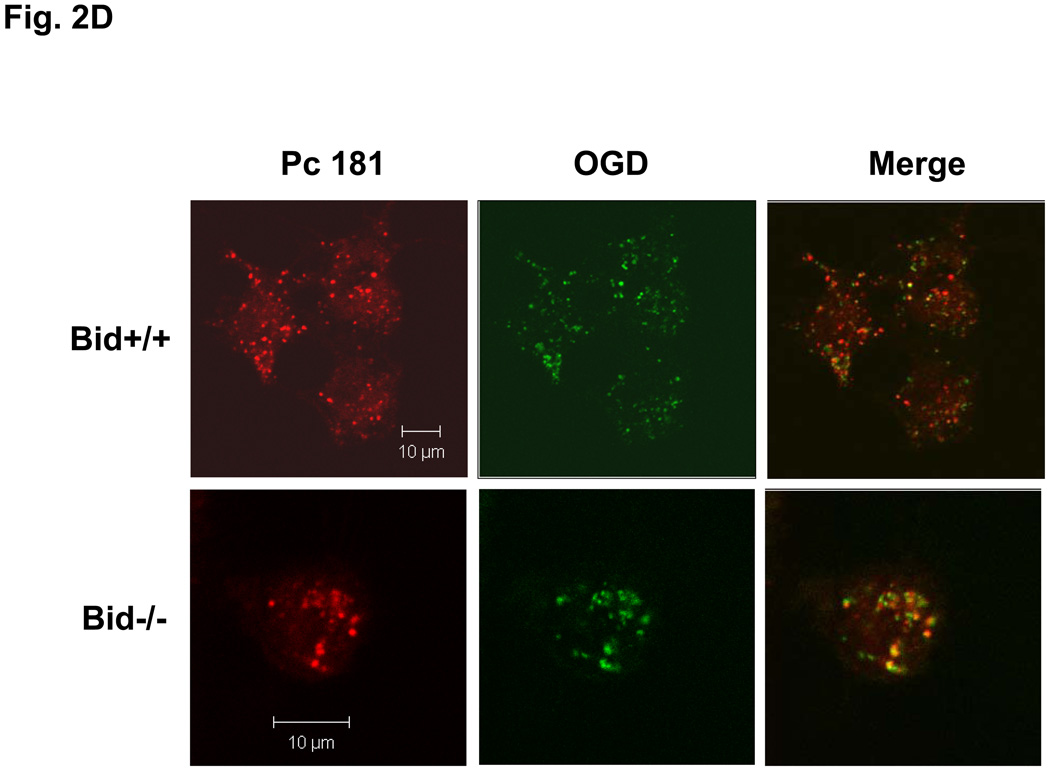
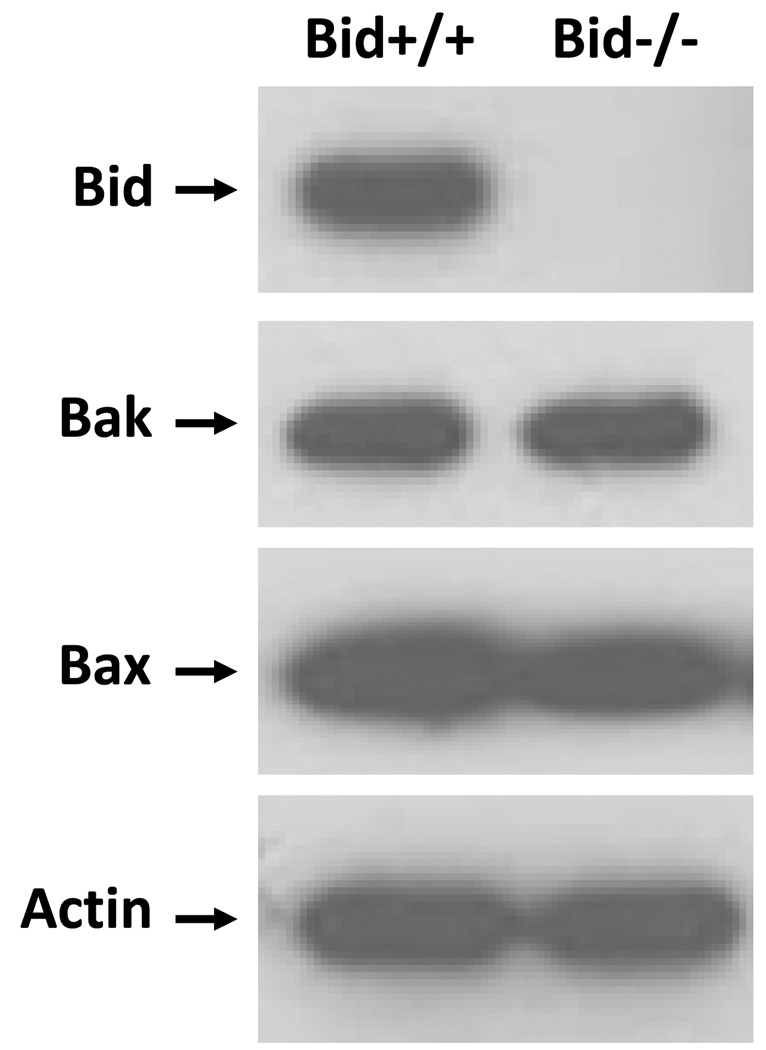
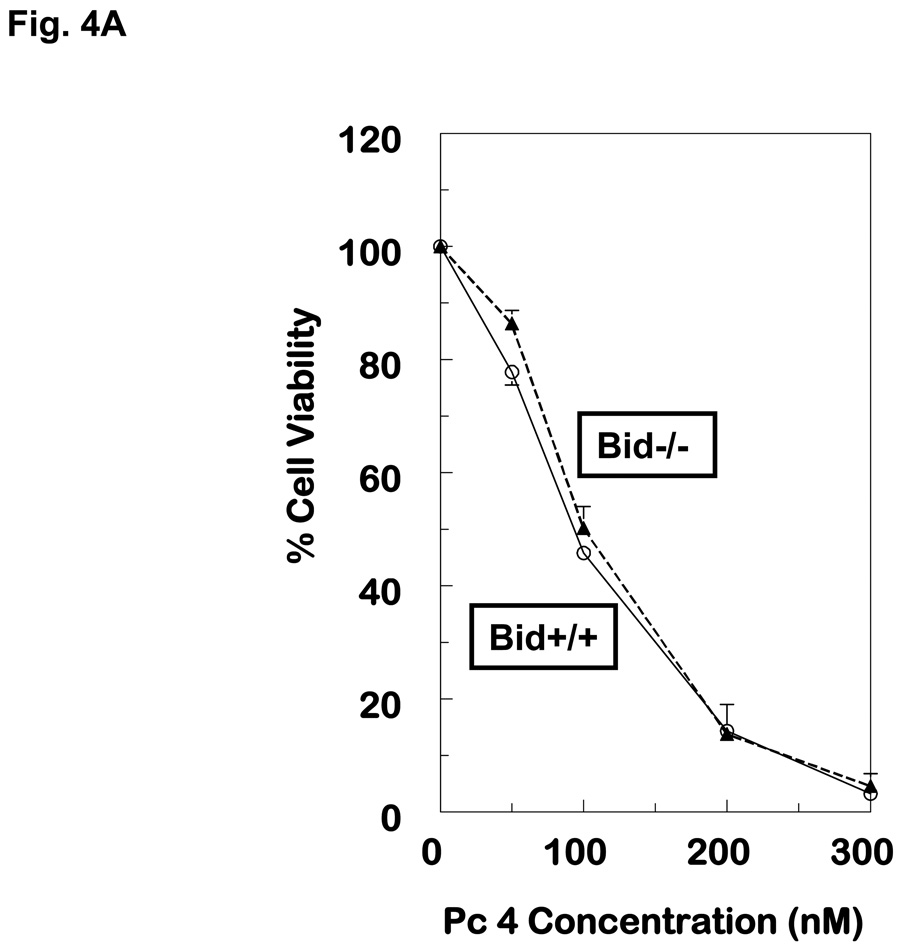
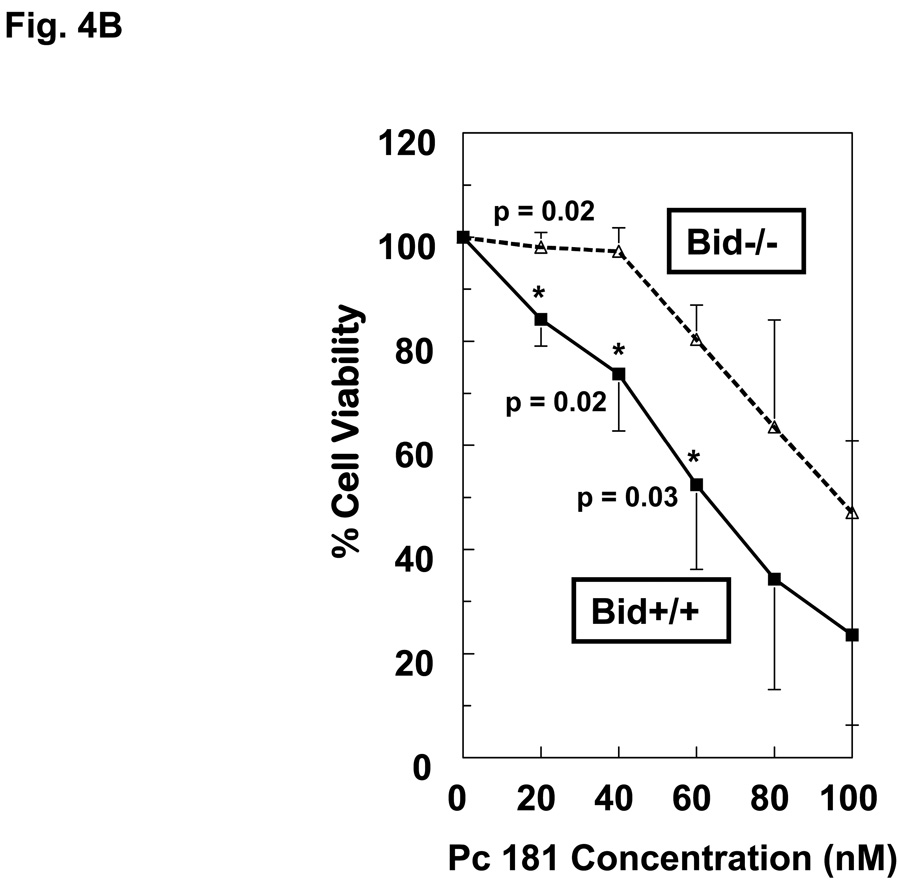
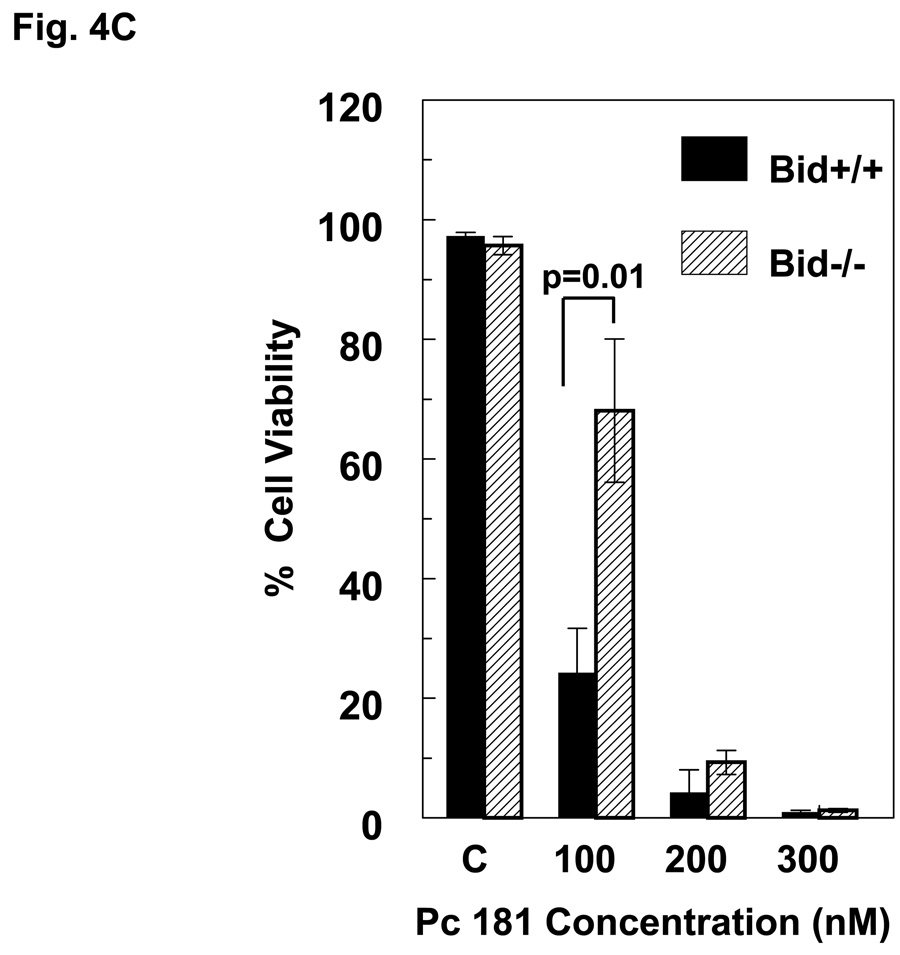
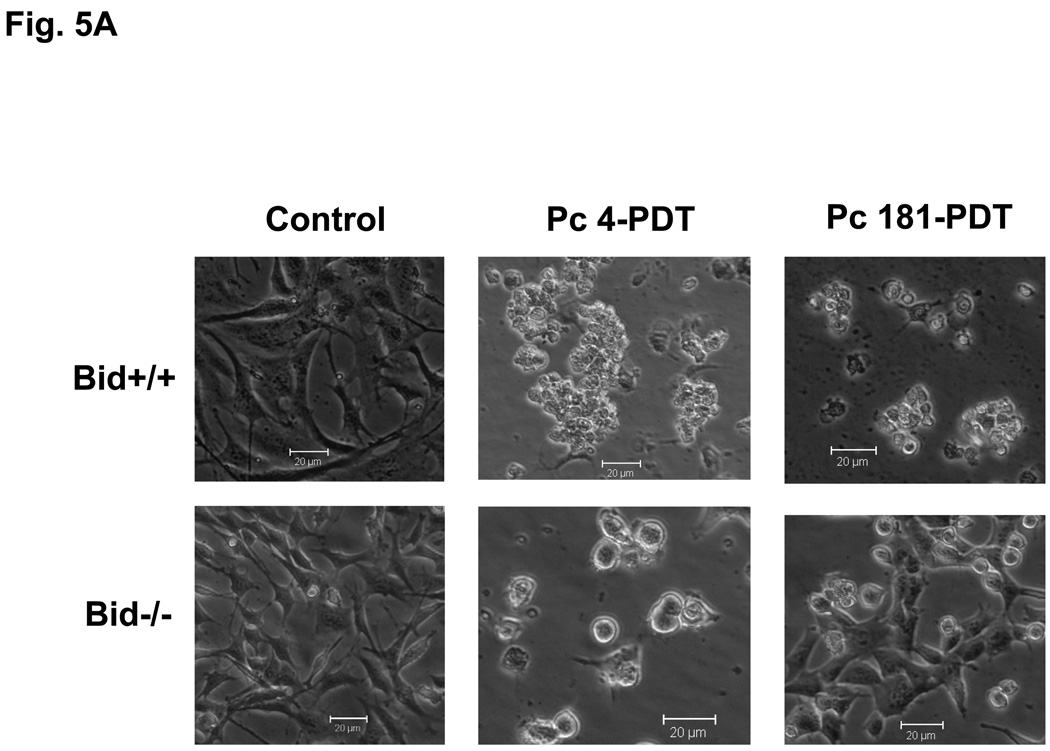
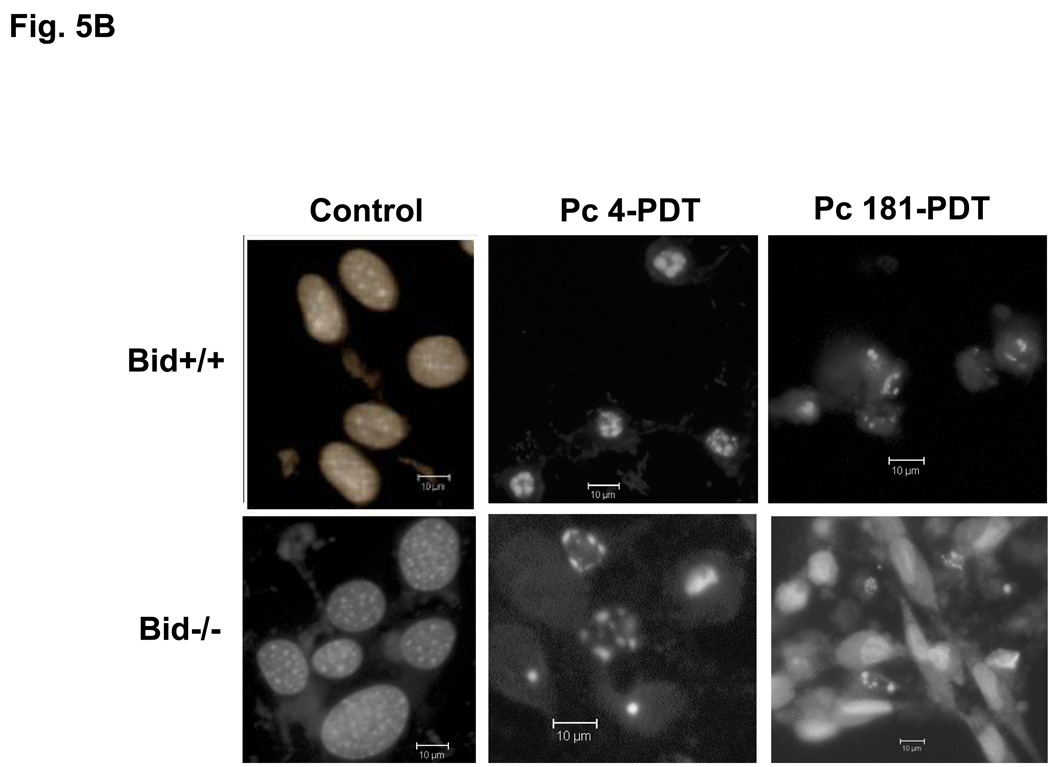
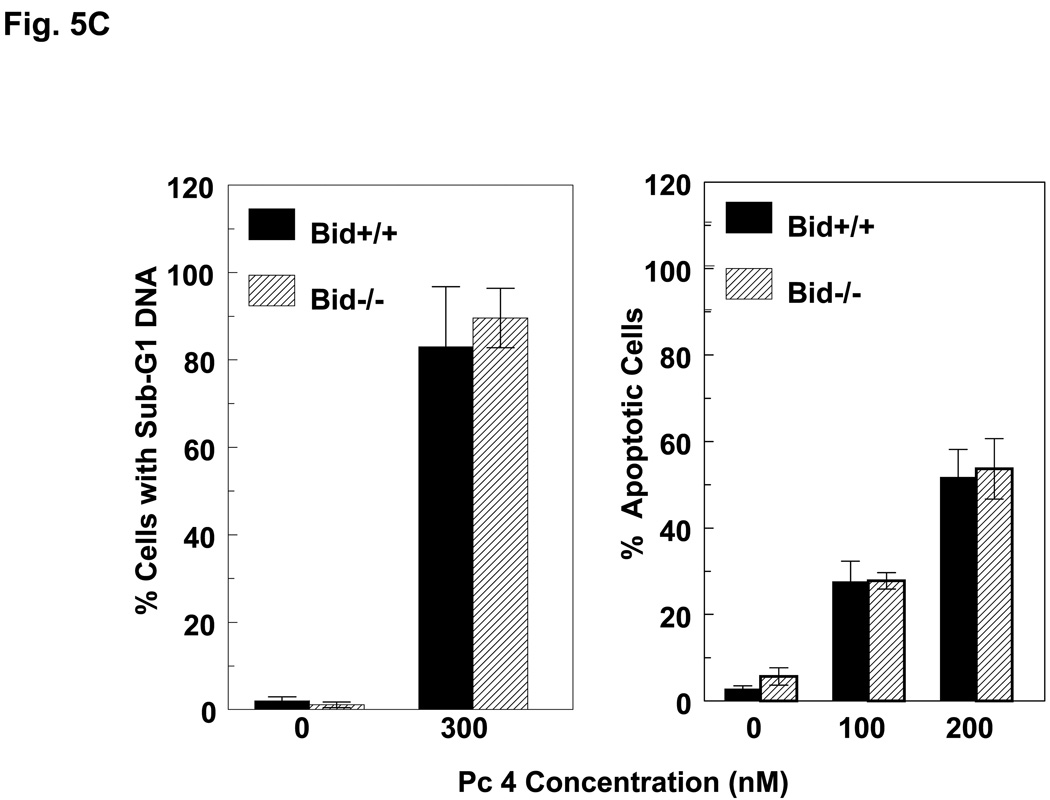
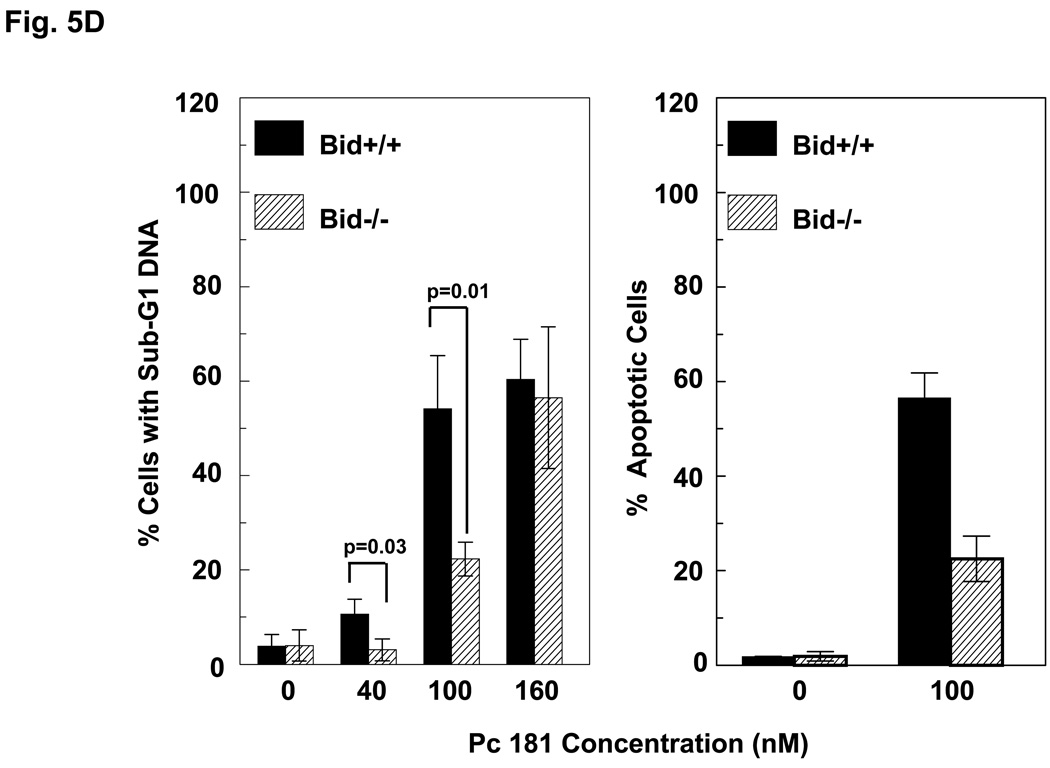
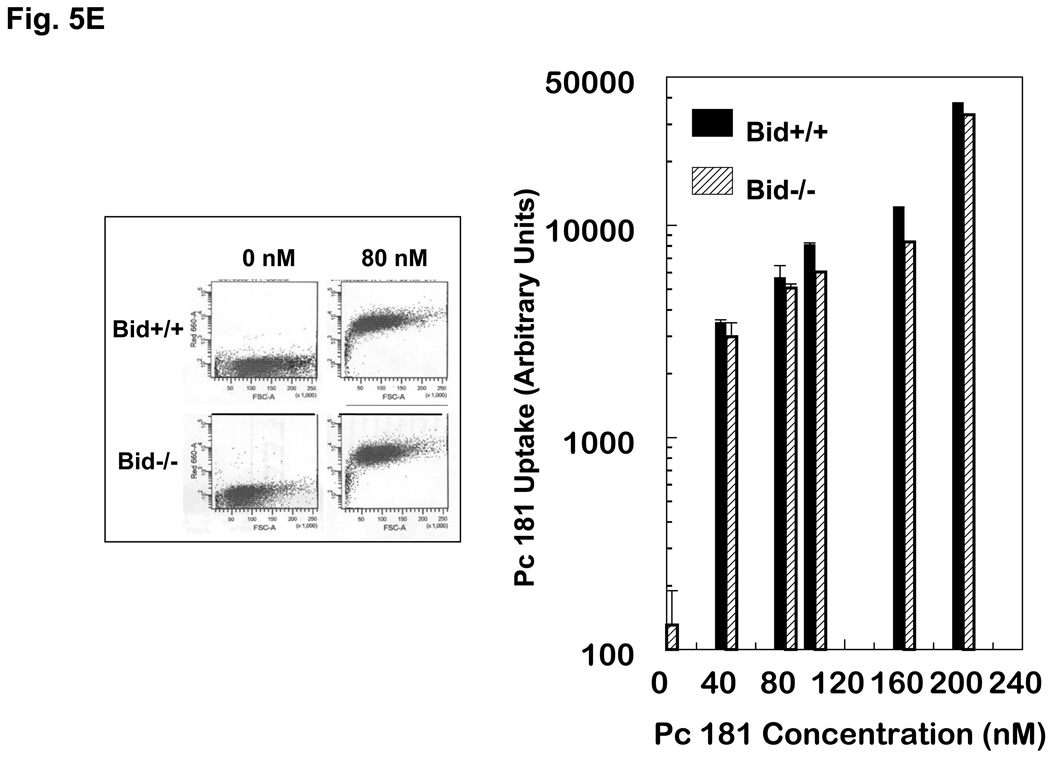
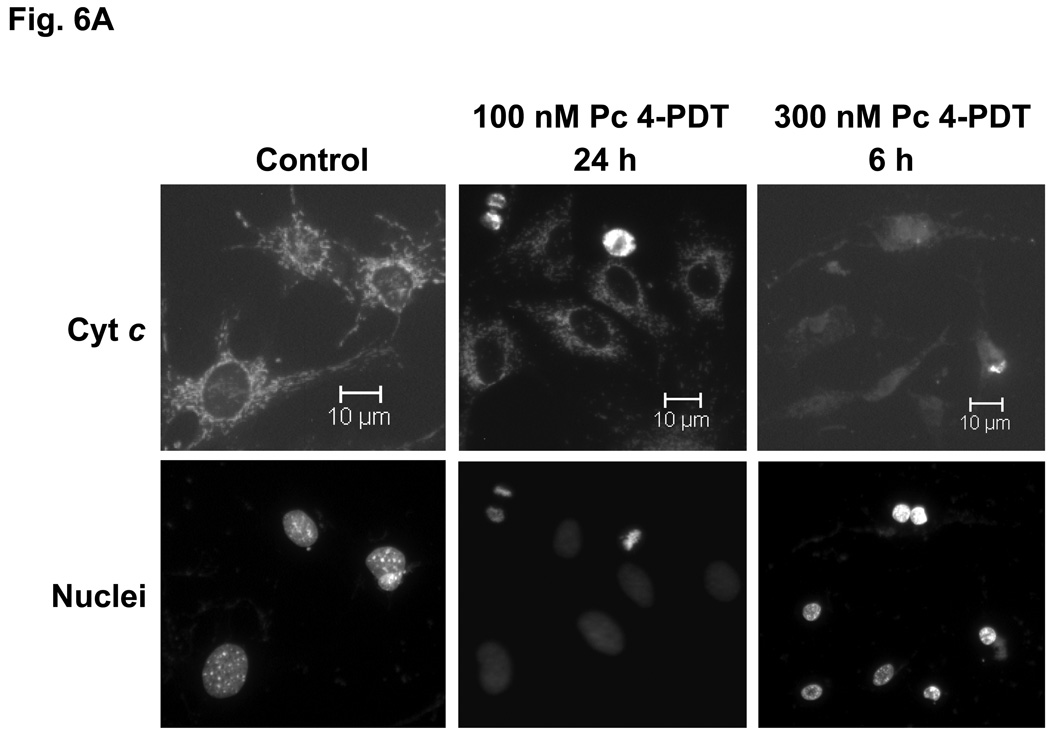
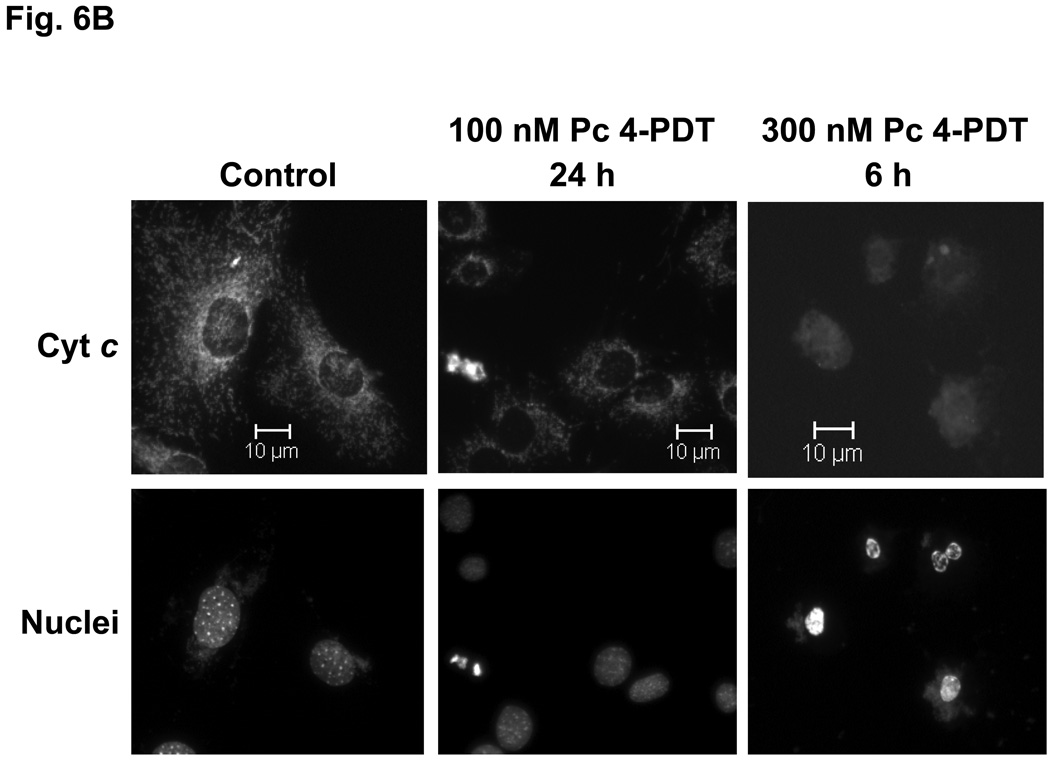
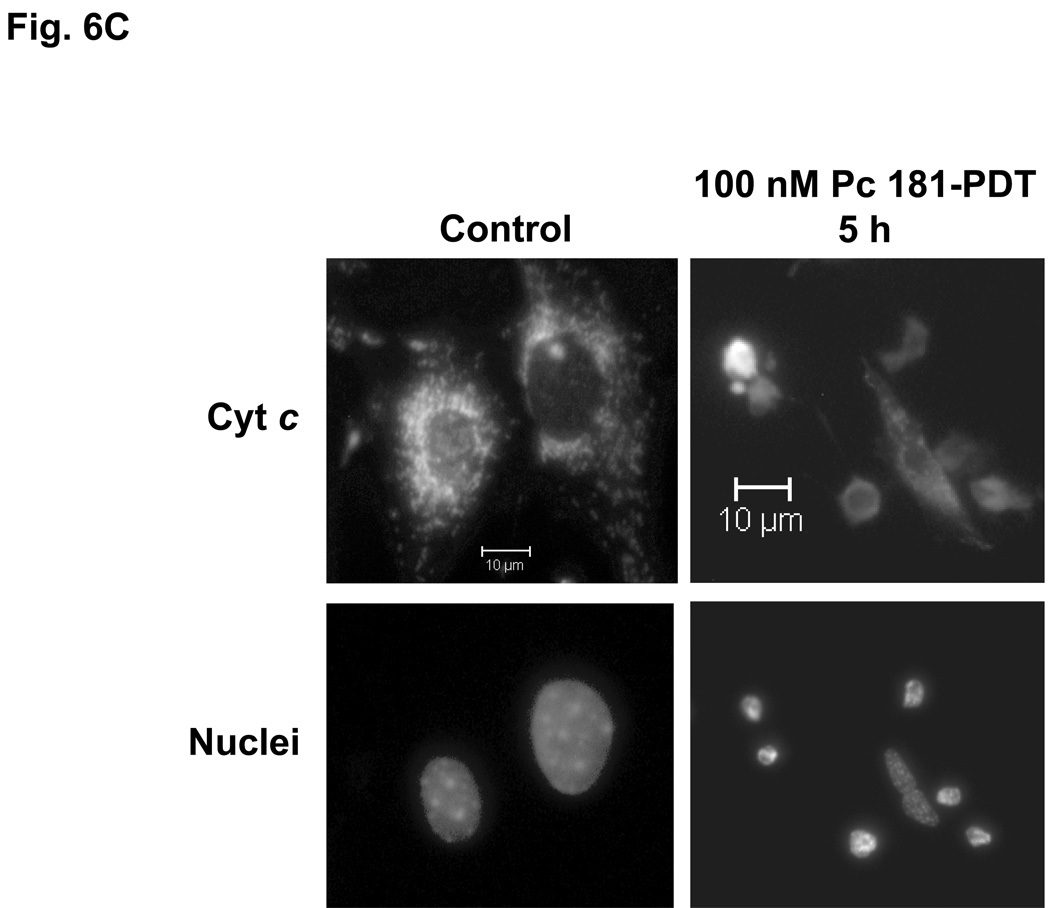
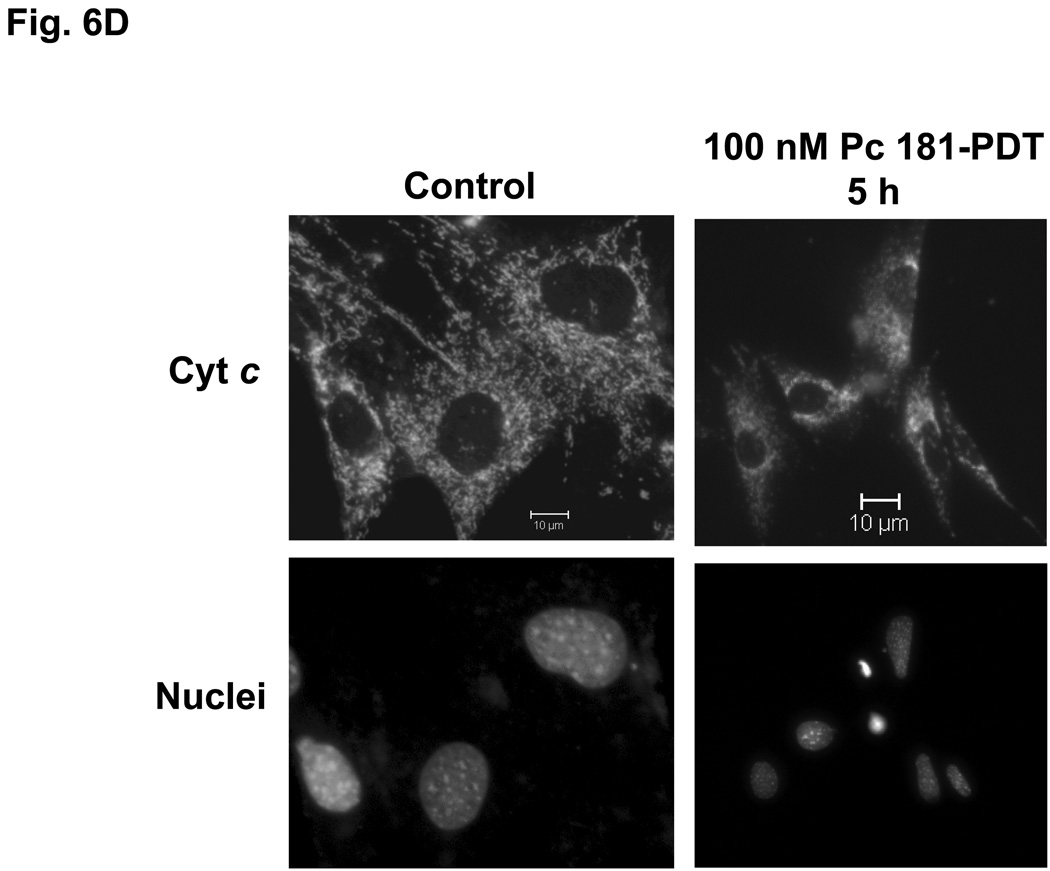
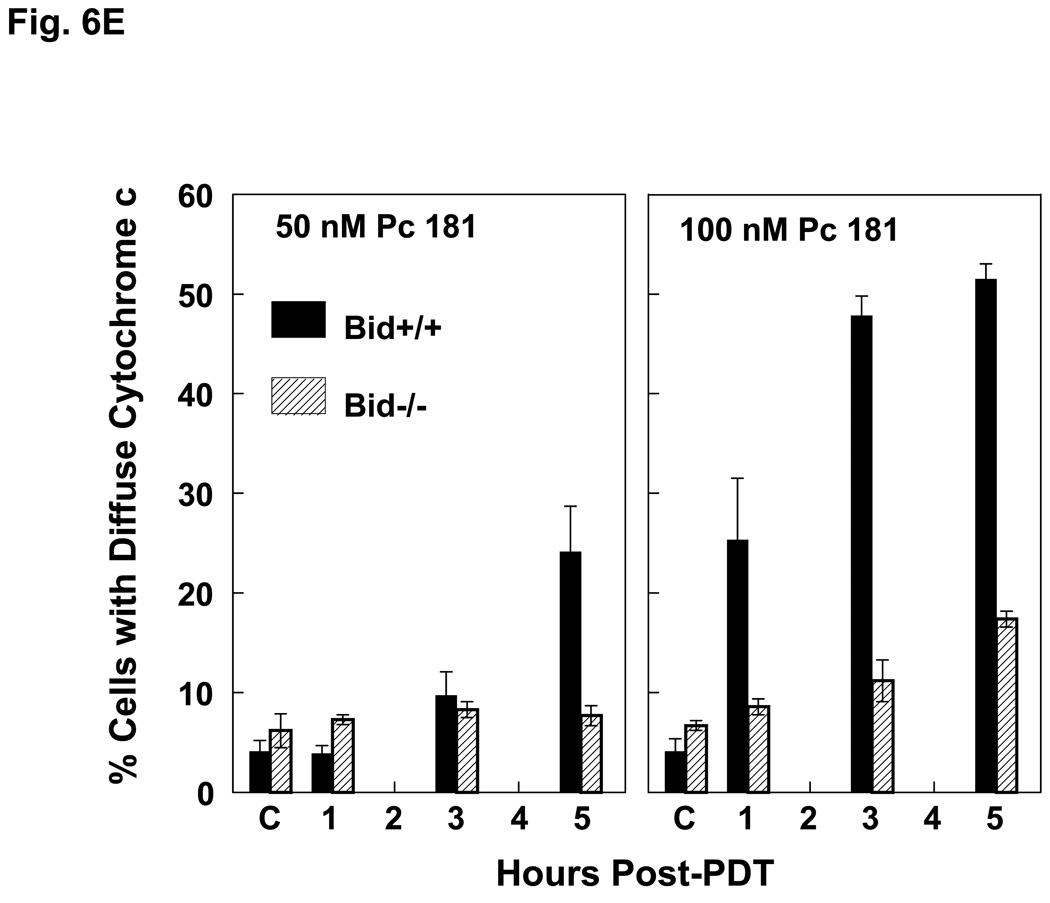
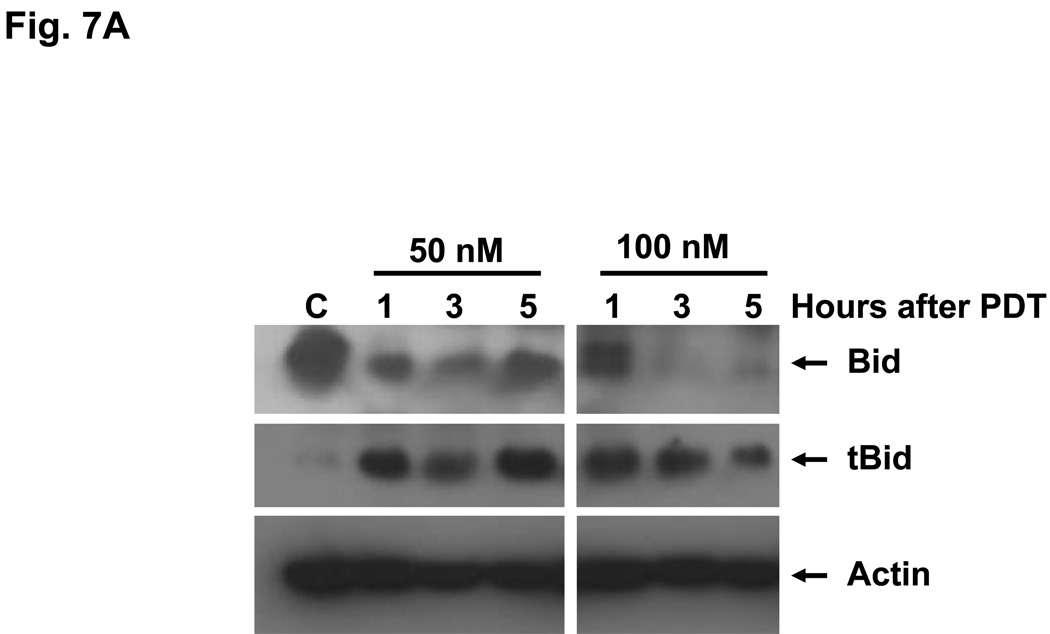
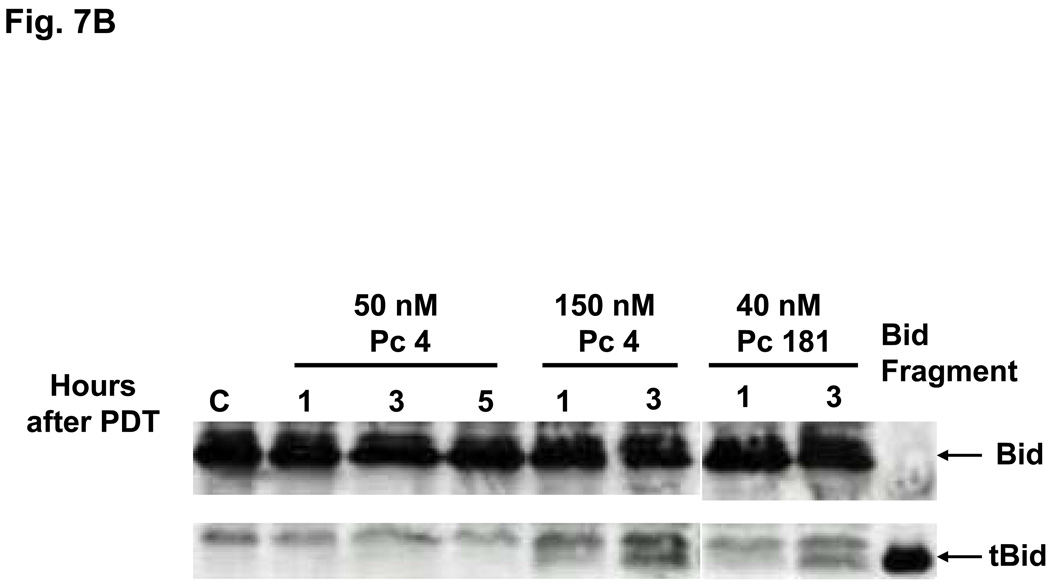
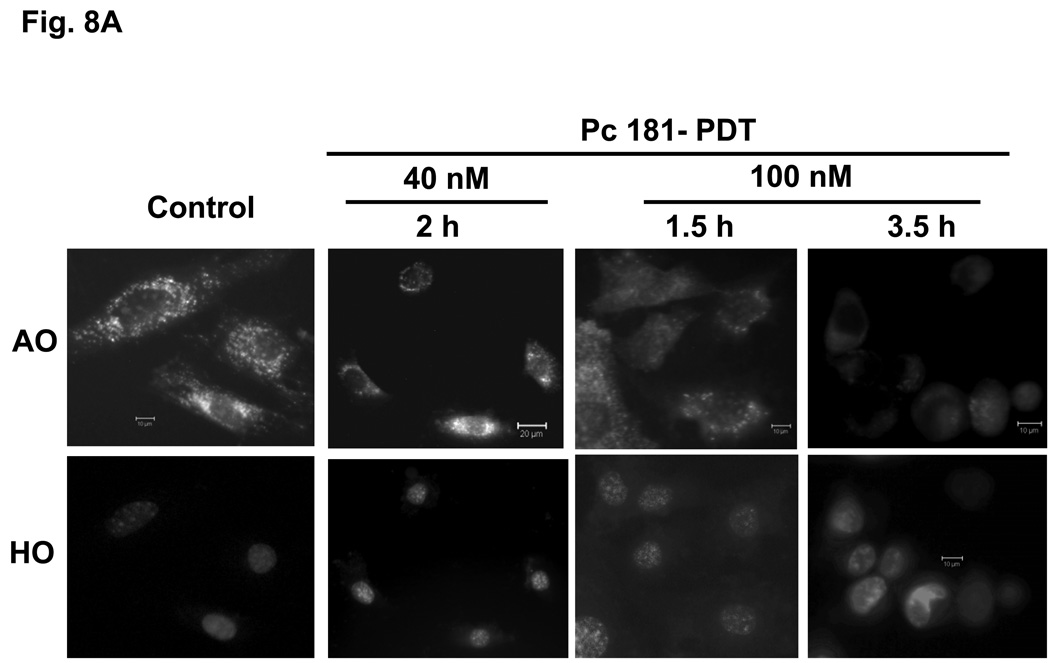
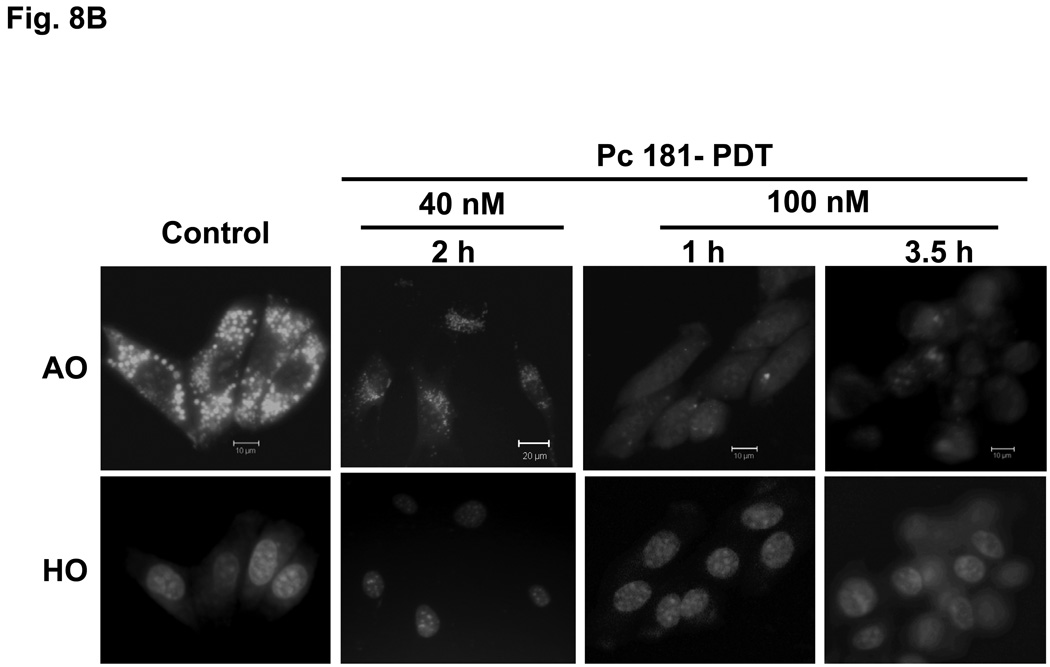
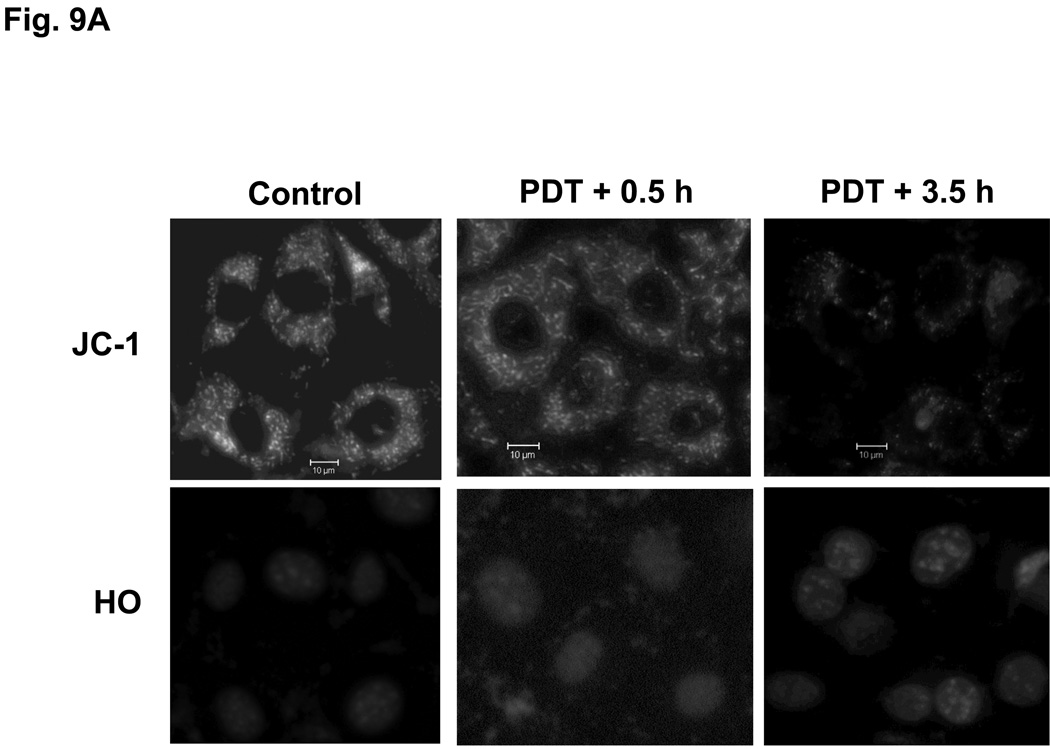
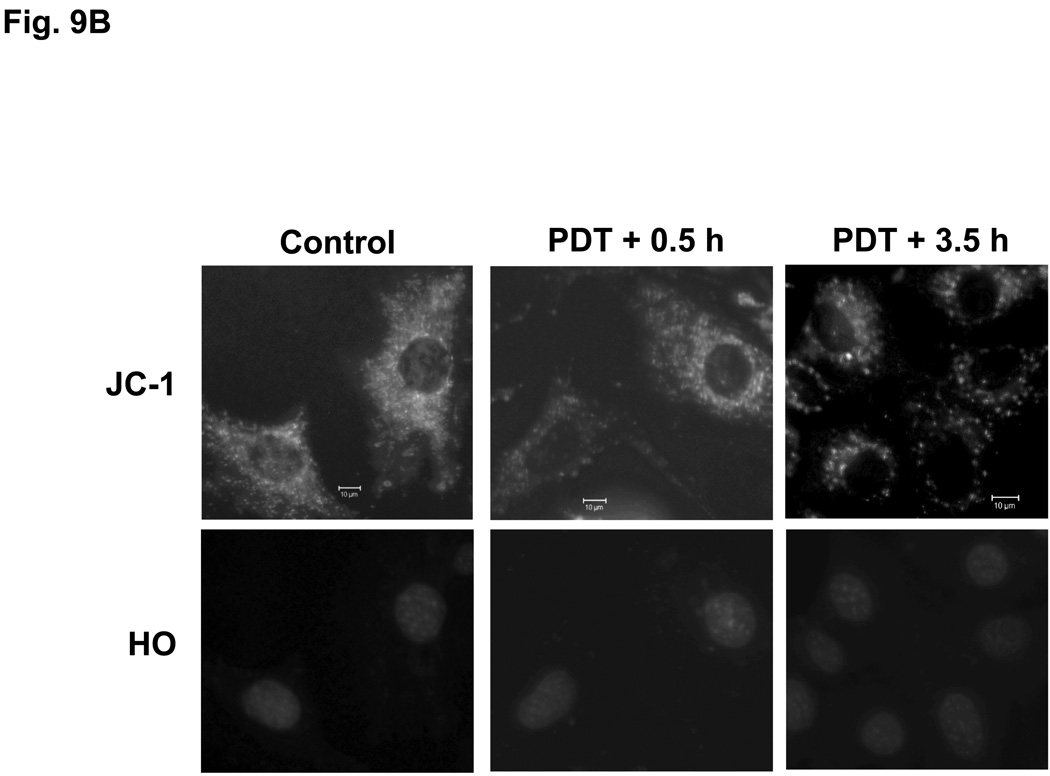
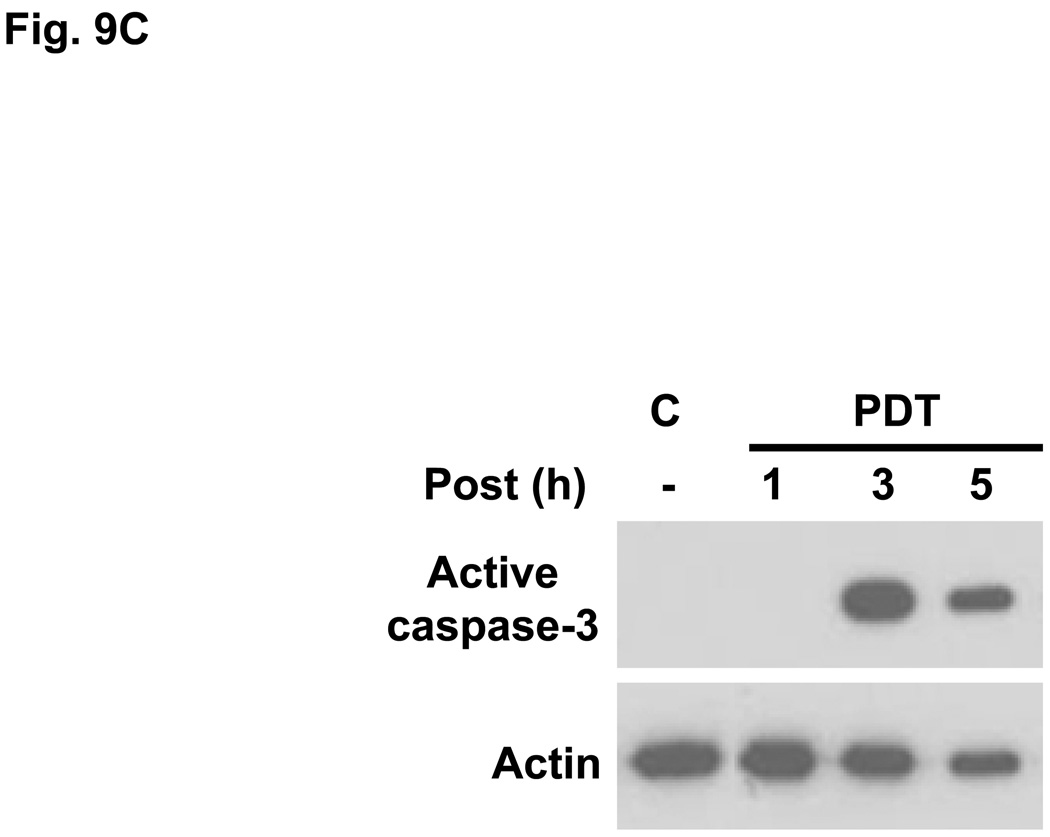
Photodynamic therapy (PDT) with lysosome-targeted photosensitizers induces the intrinsic pathway of apoptosis via the cleavage and activation of the BH3-only protein Bid by proteolytic enzymes released from photodisrupted lysosomes. To investigate the role of Bid in apoptosis induction and the role of damaged lysosomes on cell killing by lysosome-targeted PDT, we compared the responses of wild type and Bid-knock-out murine embryonic fibroblasts toward a mitochondrion/endoplasmic reticulum-binding photosensitizer, Pc 4, and a lysosome-targeted sensitizer, Pc 181. Whereas apoptosis and overall cell killing were induced equally well by Pc 4-PDT in both cell lines, Bid(-/-) cells were relatively resistant to induction of apoptosis and to overall killing following PDT with Pc 181, particularly at low PDT doses. Thus, Bid is critical for the induction of apoptosis caused by PDT with the lysosome-specific sensitizers, but dispensable for PDT targeted to other membranes.


Figures

Fig. 1
Fig. 1
Structures of Pc 4 and Pc 181
Fig. 2
Fig. 2
Localization of Pc 4 and Pc 181 in MEFs. MEFs were cultured in glass-bottom dishes, loaded with either with 200 nM Pc 4 (A, B) or 100 nM Pc 181 (C, D) and incubated at 37° C for 18 h. The cultures were further incubated with either 100 nM MTG (A, C) or 0.2 mg/mL OGD (B, D). They were then viewed by confocal microscopy
Fig. 2
Fig. 2
Localization of Pc 4 and Pc 181 in MEFs. MEFs were cultured in glass-bottom dishes, loaded with either with 200 nM Pc 4 (A, B) or 100 nM Pc 181 (C, D) and incubated at 37° C for 18 h. The cultures were further incubated with either 100 nM MTG (A, C) or 0.2 mg/mL OGD (B, D). They were then viewed by confocal microscopy
Fig. 3
Fig. 3
Western blot analysis of the expression of Bid, Bax, Bak, and actin (as loading control) in Bid+/+ and Bid−/− cells. Equal amounts of protein from whole cell lysates were resolved on SDS-PAGE and processed for western blot analysis
Fig. 4
Fig. 4
Dose dependence of the loss of cell viability. Exponentially growing cultures of Bid+/+ or Bid−/− cells in 96-well plates were incubated 6–18 h in either 0–300 nM Pc 4 (A) or 0–100 nM Pc 181 (B). The cultures were irradiated with 200 mJ/cm2 red light and subjected to MTT assay after 22 h of post-irradiation incubation. Data are the mean ± SD of results of duplicate plates in 3 experiments. (C) Viability of Bid+/+ and Bid−/− cells 20 h after Pc 181-PDT (100 nM Pc 181 + 200 mJ/cm2 red light), as determined by trypan blue exclusion. The data represent the mean ± SD of duplicate measurements on at least 150 cells in each of two experiments
Fig. 4
Fig. 4
Dose dependence of the loss of cell viability. Exponentially growing cultures of Bid+/+ or Bid−/− cells in 96-well plates were incubated 6–18 h in either 0–300 nM Pc 4 (A) or 0–100 nM Pc 181 (B). The cultures were irradiated with 200 mJ/cm2 red light and subjected to MTT assay after 22 h of post-irradiation incubation. Data are the mean ± SD of results of duplicate plates in 3 experiments. (C) Viability of Bid+/+ and Bid−/− cells 20 h after Pc 181-PDT (100 nM Pc 181 + 200 mJ/cm2 red light), as determined by trypan blue exclusion. The data represent the mean ± SD of duplicate measurements on at least 150 cells in each of two experiments
Fig. 5
Fig. 5
Induction of apoptosis by PDT with Pc 4 or Pc 181. (A,B) Change in cell (A) and nuclear (B) morphology after PDT. Bid+/+ and Bid−/− MEFs growing in 12-well plates were either untreated or treated with Pc 4-PDT (300 nM Pc 4, 200 mJ/cm2 red light) or Pc 181 (100 nM Pc 181, 200 mJ/cm2 red light) followed by 24 h post-irradiation incubation. The nuclear DNA was stained with Hoechst 33342 and examined by fluorescence microscopy. (C,D) Dose dependence for the induction of apoptosis. MEFs were loaded with 0–300 nM Pc 4 (panel C) or 0–160 nM Pc 181 (panel D) for 18 h and then exposed to 200 mJ/cm2. After 20 h of further incubation, apoptosis was estimated by the percentage of Hoechst 33342-stained nuclei with apoptotic features (right panels) or the percentage of cells with less than the G1 content of DNA (left panels). Data for Hoechst staining represent the mean ± SD from duplicate coverslips for each condition in two independent experiments. Data for sub-G1 DNA content represent the mean percentage of cells with sub-G1 DNA from duplicate cultures in each of three experiments ± SD. (E) Concentration dependence of the uptake of Pc 181 into Bid+/+ and Bid−/− MEFs. Exponentially growing cultures were loaded with 0–200 nM Pc 181 for 16–18 h. Cells were collected, washed, and analyzed by flow cytometry
Fig. 5
Fig. 5
Induction of apoptosis by PDT with Pc 4 or Pc 181. (A,B) Change in cell (A) and nuclear (B) morphology after PDT. Bid+/+ and Bid−/− MEFs growing in 12-well plates were either untreated or treated with Pc 4-PDT (300 nM Pc 4, 200 mJ/cm2 red light) or Pc 181 (100 nM Pc 181, 200 mJ/cm2 red light) followed by 24 h post-irradiation incubation. The nuclear DNA was stained with Hoechst 33342 and examined by fluorescence microscopy. (C,D) Dose dependence for the induction of apoptosis. MEFs were loaded with 0–300 nM Pc 4 (panel C) or 0–160 nM Pc 181 (panel D) for 18 h and then exposed to 200 mJ/cm2. After 20 h of further incubation, apoptosis was estimated by the percentage of Hoechst 33342-stained nuclei with apoptotic features (right panels) or the percentage of cells with less than the G1 content of DNA (left panels). Data for Hoechst staining represent the mean ± SD from duplicate coverslips for each condition in two independent experiments. Data for sub-G1 DNA content represent the mean percentage of cells with sub-G1 DNA from duplicate cultures in each of three experiments ± SD. (E) Concentration dependence of the uptake of Pc 181 into Bid+/+ and Bid−/− MEFs. Exponentially growing cultures were loaded with 0–200 nM Pc 181 for 16–18 h. Cells were collected, washed, and analyzed by flow cytometry
Fig. 6
Fig. 6
Pc 181-PDT fails to induce the release of cytochrome c in Bid−/− cells. MEFs were untreated or treated with either 100–300 nM Pc 4 (A, B) or 100 nM Pc 181 (C, D) plus red light followed by 5–24 h of incubation. The release of cytochrome c from mitochondria was monitored by fluorescence immunostaining. (A,C) Bid+/+, (B,D) Bid−/− cells. Nuclear DNA was stained with Hoechst 33342. (E) Time course for the release of cytochrome c from mitochondria in MEFs following PDT with 50 (left panel) or 100 (right panel) nM Pc 181. The percentage of cells with diffuse cytochrome c was estimated in at least 200 cells on duplicate cover slips such as those in panels C and D. Data represent the mean ± SD from duplicate coverslips for each condition in one (for 50 nM) or two (for 100) independent experiments
Fig. 6
Fig. 6
Pc 181-PDT fails to induce the release of cytochrome c in Bid−/− cells. MEFs were untreated or treated with either 100–300 nM Pc 4 (A, B) or 100 nM Pc 181 (C, D) plus red light followed by 5–24 h of incubation. The release of cytochrome c from mitochondria was monitored by fluorescence immunostaining. (A,C) Bid+/+, (B,D) Bid−/− cells. Nuclear DNA was stained with Hoechst 33342. (E) Time course for the release of cytochrome c from mitochondria in MEFs following PDT with 50 (left panel) or 100 (right panel) nM Pc 181. The percentage of cells with diffuse cytochrome c was estimated in at least 200 cells on duplicate cover slips such as those in panels C and D. Data represent the mean ± SD from duplicate coverslips for each condition in one (for 50 nM) or two (for 100) independent experiments
Fig. 7
Fig. 7
Cleavage of Bid following PDT with Pc 4 or Pc 181. Bid+/+ MEFs were untreated or exposed to (A) Pc 181-PDT (50 or 100 nM Pc 181, 200 mJ/cm2) or (B) Pc 4-PDT (50 or 150 nM Pc 4, 200 mJ/cm2) or Pc 181-PDT (40 nM Pc 181, 200 mJ/cm2). Cells were collected at 1, 3 and 5 h after PDT, and whole cell lysates were analyzed on western blots
Fig. 7
Fig. 7
Cleavage of Bid following PDT with Pc 4 or Pc 181. Bid+/+ MEFs were untreated or exposed to (A) Pc 181-PDT (50 or 100 nM Pc 181, 200 mJ/cm2) or (B) Pc 4-PDT (50 or 150 nM Pc 4, 200 mJ/cm2) or Pc 181-PDT (40 nM Pc 181, 200 mJ/cm2). Cells were collected at 1, 3 and 5 h after PDT, and whole cell lysates were analyzed on western blots
Fig. 8
Fig. 8
Loss of lysosomal integrity in MEFs following Pc 181-PDT. Bid+/+ (A) and Bid−/− (B) cells grown on coverslips were either untreated or treated with PDT (40 or 100 nM Pc 181, 200 mJ/cm2 red light). After various periods of post-irradiation incubation, cultures were loaded with 1µg/mL of acridine orange (AO) and Hoechst 33342 (HO) for 20 min and examined by fluorescence microscopy
Fig. 8
Fig. 8
Loss of lysosomal integrity in MEFs following Pc 181-PDT. Bid+/+ (A) and Bid−/− (B) cells grown on coverslips were either untreated or treated with PDT (40 or 100 nM Pc 181, 200 mJ/cm2 red light). After various periods of post-irradiation incubation, cultures were loaded with 1µg/mL of acridine orange (AO) and Hoechst 33342 (HO) for 20 min and examined by fluorescence microscopy
Fig. 9
Fig. 9
Loss of mitochondrial membrane potential and release of cytochrome c in MEFs following Pc 181-PDT. Bid+/+ (A) and Bid−/− (B) cells were grown and treated with PDT as indicated in Fig. 7 After 0.5 and 3.5 hours post-irradiation incubation, cells were stained with JC-1 and Hoechst 33342 for 30 min and examined by fluorescence microscopy. (C) Bid+/+ cells were evaluated for the activation of caspase-3 by western blotting at various times following PDT with 100 nM Pc 181
Fig. 9
Fig. 9
Loss of mitochondrial membrane potential and release of cytochrome c in MEFs following Pc 181-PDT. Bid+/+ (A) and Bid−/− (B) cells were grown and treated with PDT as indicated in Fig. 7 After 0.5 and 3.5 hours post-irradiation incubation, cells were stained with JC-1 and Hoechst 33342 for 30 min and examined by fluorescence microscopy. (C) Bid+/+ cells were evaluated for the activation of caspase-3 by western blotting at various times following PDT with 100 nM Pc 181

Similar articles

Cited by

References

    1. Moan J, Berg K. Photochemotherapy of cancer: experimental research. Photochem. Photobiol. 1992;55:931–948. - PubMed
    1. Weishaupt KR, Gomer CJ, Dougherty TJ. Identification of singlet oxygen as the cytotoxic agent in photoinactivation of a murine tumor. Cancer Res. 1976;36:2326–2329. - PubMed
    1. Peng Q, Moan J, Nesland JM. Correlation of subcellular and intratumoral photosensitizer localization with ultrastructural features after photodynamic therapy. Ultrastruct Pathol. 1996;20:109–129. - PubMed
    1. Oleinick NL, Morris RL, Belichenko I. The role of apoptosis in response to photodynamic therapy: what, where, why, and how. Photochem. Photobiol Sci. 2002;1:1–21. - PubMed
    1. Kessel D. Death pathways associated with photodynamic therapy. Med. Laser Appl. 2006;21:219–224. - PMC - PubMed

Publication types

MeSH terms

Substances

LinkOut - more resources