. 2010 Jun 16:9:169.
doi: 10.1186/1475-2875-9-169.

Using serological measures to monitor changes in malaria transmission in Vanuatu

Affiliations

Using serological measures to monitor changes in malaria transmission in Vanuatu

Jackie Cook et al. Malar J. .

Abstract

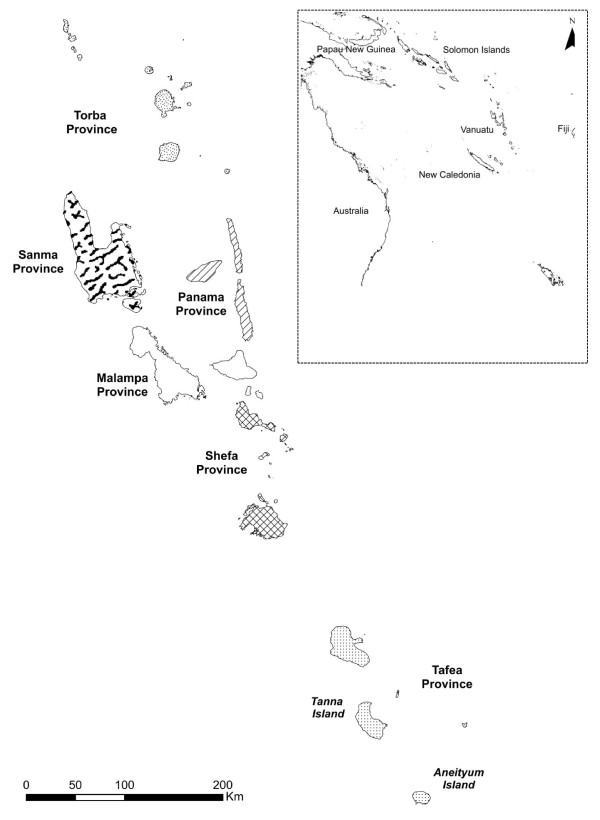
Background: With renewed interest in malaria elimination, island environments present unique opportunities to achieve this goal. However, as transmission decreases, monitoring and evaluation programmes need increasingly sensitive tools to assess Plasmodium falciparum and Plasmodium vivax exposure. In 2009, to assess the role of serological markers in evaluating malaria transmission, a cross-sectional seroprevalence study was carried out in Tanna and Aneityum, two of the southernmost islands of the Vanuatu archipelago, areas where malaria transmission has been variably reduced over the past few decades.

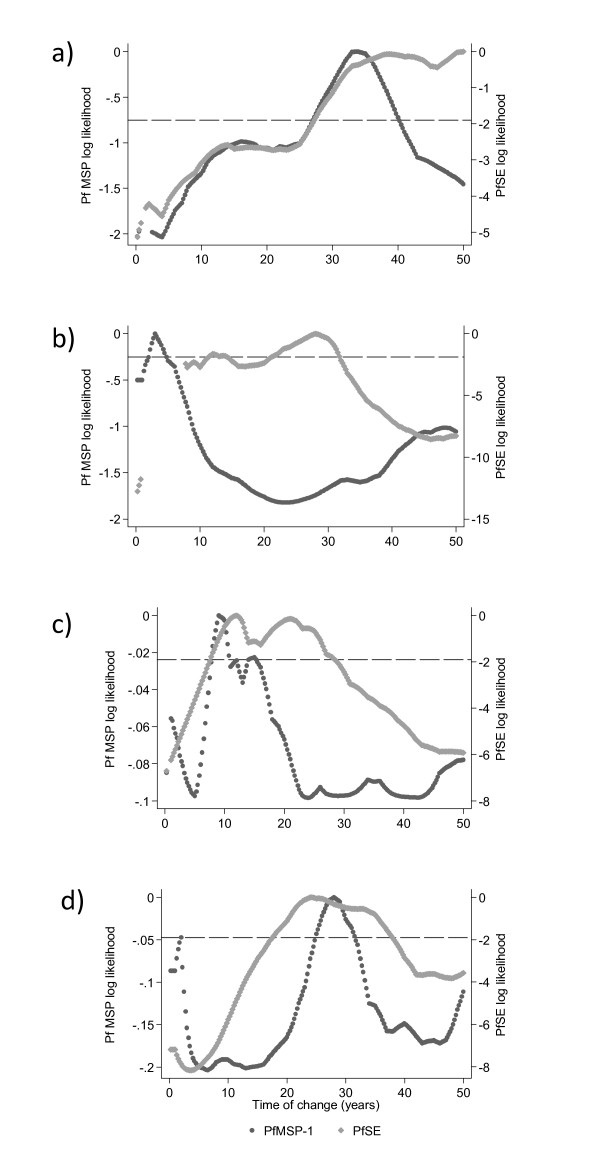
Methods: Malaria transmission was assessed using serological markers for exposure to P. falciparum and P. vivax. Filter blood spot papers were collected from 1,249 people from Tanna, and 517 people from Aneityum to assess the prevalence of antibodies to two P. falciparum antigens (MSP-119 and AMA-1) and two P. vivax antigens (MSP-119 and AMA-1). Age-specific prevalence was modelled using a simple catalytic conversion model based on maximum likelihood to generate a community seroconversion rate (SCR).

Results: Overall seropositivity in Tanna was 9.4%, 12.4% and 16.6% to P. falciparum MSP-119, AMA-1 and Schizont Extract respectively and 12.6% and 15.0% to P. vivax MSP-119 and AMA-1 respectively. Serological results distinguished between areas of differential dominance of either P. vivax or P. falciparum and analysis of age-stratified results showed a step in seroprevalence occurring approximately 30 years ago on both islands, indicative of a change in transmission intensity at this time. Results from Aneityum suggest that several children may have been exposed to malaria since the 2002 P. vivax epidemic.

Conclusion: Seroepidemiology can provide key information on malaria transmission for control programmes, when parasite rates are low. As Vanuatu moves closer to malaria elimination, monitoring changes in transmission intensity and identification of residual malaria foci is paramount in order to concentrate intervention efforts.


Figures

Figure 1
Figure 1
Location of Tanna and Aneityum, Vanuatu in the South West Pacific. Map of Vanuatu showing the location of Tafea Province within the country and the location of Vanuatu with respect to neighbouring countries in the Western Pacific region (inset).
Figure 2
Figure 2
Summary of Plasmodium speciation PCR results obtained from Tanna in 2008. PCR results for children over 2 and under 15 are presented, adapted from data presented in Reid et al [22]. Each black spot represents the home settlement of at least one child involved in the survey. Children were sampled from a total of 44 villages across three settlements on Tanna.
Figure 3
Figure 3
Seroprevalence to P.falciparum and P.vivax antigens in 3 settlements from Tanna and from two settlements combined on Aneityum, by three age groups
Figure 4
Figure 4
The distribution of seroprevalence in children aged 1-10 (inclusive) in settlements on Tanna. Seroprevalence to specific P. falciparum antigens (MSP-119 and/or AMA-1) in children aged 1-10 (inclusive) is plotted in figure 4a and the equivalent for P.vivax in Figure 4b. Young children were chosen to represent local transmission as they are less likely to have travelled to areas of higher transmission. In some cases, under 10 children were sampled from a single village- these are represented by smaller circular symbols, whilst the larger symbols represent villages where more than ten, and up to 48 children were sampled.
Figure 5
Figure 5
Profile likelihood plots (PLPs) for PfMSP-119 and PfSE for a) Northern Tanna b) Northern Tanna Highlands c) Southern Tanna and d) Aneityum. Profile likelihood plots (PLPs) show the log likelihood of a catalytic conversion model allowing for a change in transmission occurring at iterative years. The maximum log likelihood is the time point at which a change in transmission is most likely to have occurred. Plots for PfAMA and the two P. vivax antigens showed no discernible peaks. The plots for Northern Tanna and Aneityum suggest a change in transmission occurred approximately 30 years ago, whilst the PLP for Southern Tanna suggests a more recent change between 10 and 20 years ago.
Figure 6
Figure 6
Seroprevalence curves for all P. falciparum antigens for each settlement. Seroprevalence curves represent the rate at which a community becomes seropositive to specific antigens, resulting in a seroconversion rate (SCR) or lambda (λ). A model allowing for a change in transmission intensity at a point in time has been fitted if profile likelihood plots showed a clear peak in log likelihood and if likelihood ratio tests resulted in a p < 0.05. In each graph points represent age seroprevalence (divided into deciles), unbroken lines represent maximum likelihood curves and broken lines 95% confidence intervals. Resulting lambdas (λ) and 95% confidence intervals are shown on seroprevalence curves. The Aneiytum PfAMA seroprevalence is uniformly low across all ages resulting in no seroconversion rate estimate.
Figure 7
Figure 7
Seroprevalence curves for all P. vivax antigens for each settlement. In each graph points represent age seroprevalence by decile. Unbroken lines represent maximum likelihood curves and broken lines 95% confidence intervals. Where possible, resulting lambdas (λ) and 95% confidence intervals are shown on seroprevalence curves.

References

    1. Feachem RGA, Phillips AA, Targett GA. Shrinking the Malaria Map: A prospectus on Malaria Elimination. The Global Health Group; 2009.
    1. Bousema T, Drakeley C, Gesase S, Hashim R, Magesa S, Mosha F, Otieno S, Carneiro I, Cox J, Msuya E, Kleinschmidt I, Maxwell C, Greenwood B, Riley E, Sauerwein R, Chandramohan D, Gosling R. Identification of hot spots of malaria transmission for targeted malaria control. J Infect Dis. 2010;201:1764–1774. doi: 10.1086/652456. - DOI - PubMed
    1. Kaneko A, Taleo G, Kalkoa M, Yamar S, Kobayakawa T, Bjorkman A. Malaria eradication on islands. Lancet. 2000;356:1560–1564. doi: 10.1016/S0140-6736(00)03127-5. - DOI - PubMed
    1. Teklehaimanot HD, Teklehaimanot A, Kiszewski A, Rampao HS, Sachs JD. Malaria in Sao Tome and principe: on the brink of elimination after three years of effective antimalarial measures. Am J Trop Med Hyg. 2009;80:133–140. - PubMed
    1. Bruce-Chwatt LJ, Draper CC, Konfortion P. Seroepidemiological evidence of eradication of malaria from Mauritius. Lancet. 1973;2:547–551. doi: 10.1016/S0140-6736(73)92361-1. - DOI - PubMed

MeSH terms